Attract Visitors to Your Site: The Mini Missing Manual (7 page)
Read Attract Visitors to Your Site: The Mini Missing Manual Online
Authors: Matthew MacDonald

Note: There are some types of repeat visitors that Google won’t correctly identify. For example, if a repeat visitor uses a different computer, a different browser, or logs into their computer with a different user name, they’ll appear to be a new visitor. For these reasons, the number of repeat visitors may be slightly
underreported.
Map Overlay
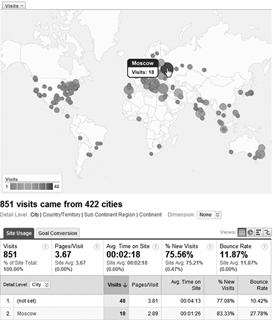
The Map Overlay section gives a fascinating look at where your visitors are located on the globe. Google Analytics divides the map into countries, and colors them different shades of green—the darker the color, the more popular your website in that country.
The Map Overlay gets even more interesting if you use the City view shown in
Figure 1-16
. To use the City view, click the “view report” link under the Map Overlay on the Dashboard. A new page appears with a larger version of the map and a detailed breakdown in a table underneath. Look for the Detail Level box at the top of the table, and then change the selection in this box from Country/Territory to City.
FREQUENTLY ASKED QUESTION
Does Google Really Know Where I Live?
How accurate is the location data Google supplies?
Being able to determine the location of your visitors is a powerful tool. After all, if you know your Graceland Vacation site is absurdly popular in Japan, you might consider accepting payments in Yen, translating a few pages, or adding some new pictures. But Google’s geographic locating service isn’t perfect. In fact, there are two weaknesses:
- The location service is based on a visitor’s ISP (Internet Service Provider), not the actual visitor herself. In many cases, the ISP is located in a different area than the visitor’s own computer.
- ISPs economize by pooling their traffic together and dumping it onto the Internet at a central location. This means that even if your visitor and her Web server are in a specific city, the computer that connects these visitors to the Internet might be somewhere else.
As a general rule of thumb, the geographic information that Google uses is likely to be close to reality, but not exact. It’s highly likely that the country is correct, but the specific city may not match that of your actual visitor.
Traffic Sources Overview
The Traffic Sources Overview is a pie chart identifying how visitors get to your site. It has three slices:
- Referring Sites.
This slice counts visitors that arrive through websites that link to yours. - Direct Traffic.
This slice counts visitors that type your URL directly into a browser or use a bookmark to make a return visit. - Search Engines.
This slice counts visitors who come to your site through a search in Google or other search engine.
Figure 1-17
shows a closer look.
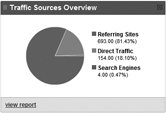
Figure 1-17:
Over the past month, 81 percent of visitors came from referring sites, while 18 percent came directly to this site (by typing in its URL). Less than 1 percent found their way through a search engine, which suggests you might want to consider investing more time in search engine optimization (see
“Rising up in the rankings”
above).
The Traffic Sources Overview provides a good high-level look at what’s going on. To get more details, click the “View Report” link underneath, or use the Traffic Sources menu on the left. You can then explore tables that break down the Referring Sites and Search Engines slices. For the Referring Sites slice, you see exactly which websites send you traffic, which is a great tool for quickly identifying your most successful Web partnerships. For the Search Engines slice, you can review the search keywords that lead to your site, which lets you determine what your visitors are looking for (and possibly diagnose why they left unhappy).
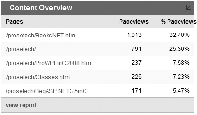
Content Overview
As every webmaster knows, all pages aren’t created equal. Some might command tremendous interest while others languish ignored. The Content Overview section lists top-performing pages (
Figure 1-18
).
However, it’s not enough to simply determine which pages your visitors view the most. Some pages are extra important because of their ability to
attract
visitors. For example, the page of Member Photos on your International Nudist site might attract large volumes of visitors who then stick around to check out your personalized coffee cups, clothing, and memorabilia. A good reporting tool also shows you where visitors
enter
your site, so you know what pages are the attention-getters that lure traffic. Almost as important are the pages that mark the end of a visit. They may indicate a problem, like a page that’s extremely large, doesn’t work correctly in some browsers, or just plain irritates people. To get this sort of detailed information in Google Analytics, click the “View Report” button in the bottom of the Content Overview section, or use the Content menu on the left side of the page.
Note: There are many more reports you can explore in Google Analytics, and many more ways to slice and dice its results to come up with conclusions about your Web traffic. In fact, entire books have been written about the fine art of analyzing website performance. However, the five charts explained above get you started with great insight into how your website is doing.
Colophon
Peter McKie was the editor for
Attract Visitors to Your Site: The Mini Missing Manual
. Nellie McKesson was the production editor.
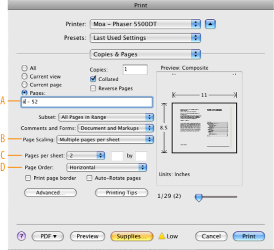
Nellie McKesson designed the interior layout, based on a series design by Phil Simpson. The text font for the PDF version of this book is Myriad Pro; and the heading and note font is Adobe Formata.
For best printing results of the PDF version of this book, use the following settings in the Adobe Reader Print dialog box: A: Pages: ii–[last page number]; B: Page Scaling: Mulitple pages per sheet;
C: Pages per sheet: 2; D: Page Order: Horizontal.