Confessions of a Greenpeace Dropout: The Making of a Sensible Environmentalist (75 page)
Read Confessions of a Greenpeace Dropout: The Making of a Sensible Environmentalist Online
Authors: Patrick Moore


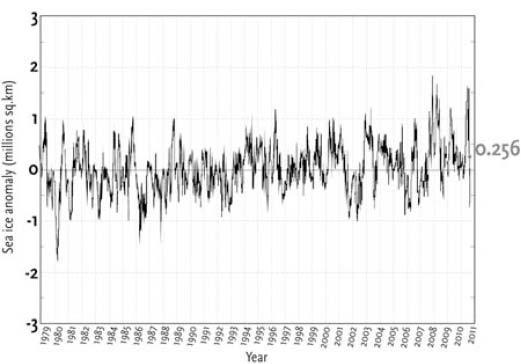
Figure 7.
Southern Hemisphere Sea Ice Anomaly (1979-2008 mean).
Graph showing the deviance from the 1979 to 2008 average extent of sea ice in the Antarctic. The winter of 2007 saw the greatest extent of Antarctic sea ice since measurements were first taken, coincident with the least extent in the Arctic. Whereas the extent of Arctic sea ice has shown a recent downward trend, the extent of Antarctic sea ice has shown an upward trend.
Our knowledge of the extent of sea ice in the Arctic and Antarctic began in 1979, the first year satellites were used to photograph the Polar Regions on a continual basis. Before 1979 it is not possible to reconstruct the comings and goings of sea ice, as unlike glaciers, sea ice leaves no trace when it melts. There is an implicit assumption among the true believers that the reduction in sea ice observed in 2007 is unique in the historical record and that we are now on a one-way trip to an ice-free Arctic Sea (see Figure 6). Putting aside the fact that mariners consider an ice-free sea a good thing, it is not possible to conclude a long-term trend in the extent of Arctic sea ice from 30 years of satellite observation.
Between 1903 and 1905 the Norwegian Raold Amundsen became the first person to navigate the Northwest Passage in a 47-ton sailing ship equipped with a small gasoline motor.
[81]
We do not know the extent of ice over the entire Arctic at that time but the fact that a small boat could sail through the passage indicates 2007 was not the only time the area of ice was reduced.
Between 1940 and 1944, years before we had any idea of the extent of sea ice during the summers and winters, a small Canadian trawler name the
St. Roch
navigated the Northwest Passage twice, from west to east and from east to west.
[82]
[83]
It was not an icebreaker and it had only a 150-horsepower diesel engine and sails. From 1910 to 1940 there was a well-documented rise in the average global temperature of nearly half a degree Celsius. There is every possibility that Arctic ice was as reduced when the
St. Roch
sailed through the passage as it has been in recent years. We will never know.
While all the media’s and activist’s attention has been on Arctic sea ice, the Antarctic has been playing out its own history in a very different way. The winter sea ice around Antarctica has grown above the average from 1979 to 2008 (See Figure 7). This has proven problematic for believers as it indicates Antarctica is cooling, contrary to what they have been led to believe by predictions based on computer models. In December 2008 Nature published an article claiming the Antarctic was warming.
[84]
Many climate activists, including Al Gore, seized on this article to bolster their belief in human-caused warming.
[85]
It turned out that the Nature article had been largely based on a computer model rather than real measurements of temperature. This represented another turning point in the questioning of the science used to claim humans were definitely causing the earth to warm up.
[86]

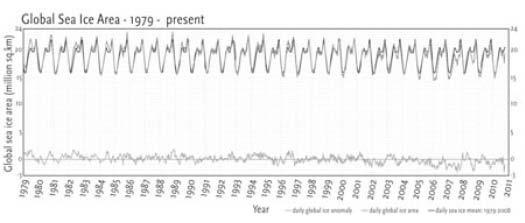
Figure 8. Global sea ice level, 1979 to present. The lower line shows the anomaly (difference from the mean) for 31 years. As you can easily see, there is no significant trend when Arctic and Antarctic sea ice areas are added together.
In 2009 the U.S. Geological Survey (USGS) published a paper in which it reported sea ice had retreated in one part of the Antarctic Peninsula.
[87]
The paper made it clear that ice was growing in other parts of Antarctica and it was not clear whether the total amount of ice on and around the continent was shrinking or growing. In Greenpeace-like fashion the USGS then issued a media release claiming the sea ice was “disappearing” in Antarctica and that sea level rise was imminent.
[88]
News services picked up this story, which gave the impression Antarctica was melting away. Perhaps the USGS scientists feel the need to sensationalize their otherwise good research in order to get more funding. I don’t know, but it certainly misleads the public about what is really happening down there.
The University of Illinois’ website,
The Cryosphere Today
, contains the entire record of sea ice since 1979.
[89]
(The Cryosphere is the area of the earth covered with ice.) Figure 8 shows the global sea ice cover, adding together the Arctic and the Antarctic, from 1979 until the present.
[90]
This is our total knowledge of the history of sea ice cover on planet Earth. There is no obvious trend up or down because increased ice cover in the Antarctic offsets most of the reduced ice cover in the Arctic. So even the very short record we do have for global sea ice cover provides no evidence of a warming trend, either natural or human-caused.
Coral Reefs, Shellfish, and “Ocean Acidification”
It has been widely reported in the media, based on a few scientific papers, that the increasing levels of CO
2
in the atmosphere will result in “ocean acidification,” threatening coral reefs and all marine shellfish with extinction within 20 years.
[91]
The story goes like this: The oceans absorb about 25 percent of the CO
2
we emit into the atmosphere each year. The higher the CO
2
content of the atmosphere, the more CO
2
will be absorbed by the oceans. When CO
2
is dissolved in water, some of it is converted into carbonic acid that has a weak acidic effect. If the sea becomes more acidic, it will dissolve the calcium carbonate that is the main constituent of coral and the shells of clams, shrimp, crabs,
etc.
It is one more doomsday scenario, predicting the seas will “degrade into a useless tidal desert,”
[92]
In his latest book,
Eaarth: Making a Life on a Tough New Planet
, Bill McKibben claims, “Already the ocean is more acid than anytime in the last 800,000 years, and at current rates by 2050 it will be more corrosive than anytime in the past 20 million years.” In typical hyperbolic fashion, McKibben, the author of the well-know essay, “The End of Nature,” uses the words
acid
and
corrosive
as if the ocean will burn off your skin and flesh to the bone if you dare swim in it in 2050. This is just plain fear-mongering.
Results of research published in the journal
Science
by M.R. Palmer et al., indicate that over the past 15 million years, “All five samples record surface seawater pH values that are within the range observed in the oceans today, and they all show a decrease in the calculated pH with depth that is similar to that observed in the present-day equatorial Pacific.” The five samples recorded pH values for 85,000 years ago and for 2.5, 6.4, 12.1, and 15.7 million years ago.
[93]
First, one should point out that the ocean is not acidic, it has a pH of 8.1, which is alkaline, the opposite of acidic. A pH of 7 is neutral, below 7 is acidic, above 7 is alkaline. Researchers have reported in scientific journals that the pH of the seas has gone down by 0.075 over the past 250 years, “Between 1751 and 1994 surface ocean pH is estimated to have decreased from approximately 8.179 to 8.104 (a change of [?]0.075).”
[94]
One has to wonder how the pH of the ocean was measured to an accuracy of three decimal places in 1751 when the concept of pH was not introduced until 1909.
[95]
It turns out that just as with climate science in general, these predictions are based on computer models. But oceans are not simple systems whose components can just be plugged into a computer. First, there is the complex mix of elements and salts dissolved in the sea. Every element on Earth is present in seawater and these elements interact in complex ways. Then there is the biological factor, tens of thousands of species that are consuming and excreting every day. The salt content of seawater gives the oceans a very large buffering capacity against change in pH. Small additions of acidic and alkaline substances can easily alter the pH of freshwater, whereas seawater can neutralize large additions of acidic and alkaline substances.
One of the most important biological phenomena in the sea is the combining of calcium, carbon, and oxygen to form calcium carbonate, CaCO
3
, the primary constituent of corals and shells, including the skeletons of microscopic plankton. The formation of calcium carbonate is called calcification. All of the vast chalk, limestone, and marble deposits in the earth’s crust are composed of calcium carbonate, which was created and deposited by marine organisms over millions of years. The carbon in calcium carbonate is derived from CO
2
dissolved in seawater. One might therefore imagine that an increase in CO
2
in seawater would enhance calcification rather than destroy it. It turns out this is precisely the case.
As is the case with terrestrial plants, it has been thoroughly demonstrated that increased CO
2
concentration in the sea results in higher rates of photosynthesis and faster growth. Photosynthesis has the effect of increasing the pH of the water, making it more alkaline, counteracting any minor acidic effect of the CO
2
itself.
[96]
The owners of saltwater aquariums often add CO
2
to the water in order to increase photosynthesis and calcification, a practice that is similar to greenhouse growers adding CO
2
to the air in their greenhouses to promote the faster growth of plants. The vast bulk of scientific literature indicates increased CO
2
in the ocean will actually result in increased growth and calcification, as opposed to the catastrophe scenario pushed by the NRDC, Greenpeace, and many other activist organizations.
[97]
[98]
A long list of scientific publications that support the view that increased CO
2
in seawater results in increased calcification can be found on the CO
2
Science website.
[99]
A paper by Atkinson et al., published in the journal
Coral Reefs
, states that their finding “seems to contradict conclusions … that high CO
2
may inhibit calcification.”
[100]