Read Hope's Edge: The Next Diet for a Small Planet Online
Authors: Frances Moore Lappé; Anna Lappé
Tags: #Health & Fitness, #Political Science, #Vegetarian, #Nature, #Healthy Living, #General, #Globalization - Social Aspects, #Capitalism - Social Aspects, #Vegetarian Cookery, #Philosophy, #Business & Economics, #Globalization, #Cooking, #Social Aspects, #Ecology, #Capitalism, #Environmental Ethics, #Economics, #Diets, #Ethics & Moral Philosophy
Hope's Edge: The Next Diet for a Small Planet (46 page)

Appendix C. Protein-Calorie Guidelines for Evaluating Foods
One way to demonstrate that most plant foods are good protein sources is to ask: do most plant foods provide adequate protein without exceeding calorie needs? By this test, most plant foods not only qualify as good protein sources, they excel.
First, from a day’s diet, let’s subtract those foods that provide
no
protein—oil, butter, sugar, honey, alcohol, and most fruits (fruits provide so little as to be almost insignificant). In a diet of people conscious of the need for moderation in fat and sugar, these foods provide roughly 25 percent of the calories. (In the day’s menu in
Figure 10
, such foods provide about 25 percent of the calories.)
So this means that the remaining 75 percent of one’s calories—or 2,025 calories for an “average” American male of 154 pounds—comes from foods containing some protein. The average American male, according to the National Academy of Sciences, needs 56 grams of protein a day. This allowance assumes a diet with considerable animal protein. In a diet with much less animal and more plant protein than the typical American diet, that allowance would rise to 65 grams. And since each gram of protein has 4 calories, this average male needs a total of 260 calories from protein out of a total of 2,025 calories from foods with protein, or 13 percent. Now we have a basis for judging what protein foods will meet the average person’s needs on a plant food diet.
Using this guideline, if a food has 13 percent or more of its calories from protein, it qualifies as a protein source that can fill our protein needs without going over our calorie limit. All this means is that if you got all of your protein from this one food, your protein allowance would be covered. This is hypothetical, of course. Few people try to exist on one food
Just because a food—such as rice or carrots, for example—does not qualify on this list does not mean that it is not a good food and should not be eaten. Many are nutritious and should be eaten with food containing a higher percentage of protein-calories.
The following list demonstrates that almost all plant foods qualify as good protein sources, and many are exceptionally strong:
Percent of Calories from Protein

Appendix D. Protein Tables and Tips for Complementing Proteins
The tables in this appendix supply the raw material for your more complete understanding of the whys and hows of combining proteins in order to increase their usability.
The first two columns in the protein tables tell you what percent of your daily protein need is met by an average serving of a given food. The items are ranked in
decreasing
order according to the percent of their contribution to your daily protein requirement, both within each food category and by food category.
*
To fulfill your protein allowance, these percentages must add up to 100 each day
.
The last three columns of the tables show you the basis on which I arrived at these percentages: the
total
grams of protein have been reduced by the NPU score of the food in order to arrive at the grams of protein
your body can use
. This amount of usable protein I then divided by the daily protein allowance to get the percent of the daily protein allowance that an average serving fills. Simple enough.
To remind you of the importance of adjusting for protein usability, let me give you a graphic example. If, for instance, we considered that eating
½
ounce of egg protein was the same as eating ½ ounce of peanut protein, we would be greatly mistaken. The amino acid pattern of the egg protein (NPU of 94) is one that the body can use almost completely; but the body can only use half of the peanut protein (NPU of 43), because its amino acids deviate considerably from the body’s one utilizable pattern. So if you eat
½
ounce each of egg and peanut protein, you get twice as much protein from the egg as from the peanut. The percentages shown in the charts have been calculated to correct for these differences in the availability of protein to your body.
The only difficulty in adjusting for differences in protein usability is that research to determine the NPU scores of food proteins is still rudimentary. Many plant foods have not been tested, and the NPU scores that we do “know” are often based on a limited number of experiments. We can hope that this research will progress. In the meantime, even with rough estimates of protein quality, we are on better ground than if our calculations were based on
total
protein, knowing full well that 5 to 70 percent of this total is not usable by the body.
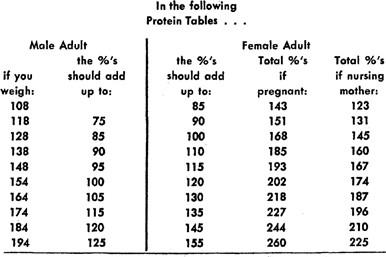
The percentages in the first two columns apply to the average American adult—a 154-pound male and a 128-pound female. If you are not quite so average, use the following guideline for determining the appropriate protein intake for your body weight.
For ages 15 to 18, add 10 to the percentage total given for your weight in
Table I
.
For children (either sex), use the second column on each protein table that follows. If a child, aged 1–3, with an approximate weight of 28 pounds, is getting enough protein, the percentages should add up to 50 percent for the day. For ages 4–6, weight approximately 44 pounds, percentages should add up to 65 percent. And for ages 7–10, weight approximately 66 pounds, percentages should add up to 78 percent.
Add up your protein intake for a few days to see whether or not you are meeting your protein allowance. If you’re not, use the tables to figure out ways to increase your intake and let it become a habit!
TABLE I. ARE YOU GETTING THE RIGHT AMOUNT OF PROTEIN FOR YOUR BODY?
Mixing Your Own Proteins
Next to the percentages in the tables are letter ratings that allow you to make up your own complementary protein combinations. The letter ratings indicate how well each type of food supplies you with a key amino acid. (Of the eight essential amino acids, only the four likely to be deficient in a diet of nonmeat protein are shown here.) Since egg protein is considered to be the most nearly perfect protein, the ratings are based on how closely the particular amino acid content of a food matches the amount of that amino acid found in egg protein.
*
Thus:

Using the protein tables, you can match the deficiencies in some foods (C and D ratings) with adequacies (A and ⅛ ratings) in other foods in order to achieve higher biological values than those of the same foods eaten separately. Discovering the patterns of amino acid strengths and weaknesses in the different food groups will enable you to do your own “protein matching.” To help you I provide two guides:
1. For foods having no serious amino acid deficiencies, such as seafood (Protein
Table I
), dairy products (Protein
Table II
), and meat and poultry (Protein
Table IX
), I have emphasized their particular strengths by putting their A + ratings in boldface. These foods need no supplementation from other foods but make excellent supplements themselves.
2. All the other protein tables have foods with serious amino acid deficiencies. The one or two most important weaknesses of each food are indicated by boxed letters. Compensation for these deficiencies can come either from the foods in category 1 above or from other foods having an
opposite
pattern of amino acid deficiency. Rather than concentrating on the names of amino acids, it might be easier simply to note the columns in which weaknesses tend to occur.
Please refer back to
this page
for a chart summarizing the complementary protein combinations. The following protein tables will give you a fuller understanding of the amino acid patterns in foods that make these combinations “work.” Following each of the nine protein tables, I also include tips for complementing that particular food’s protein.


Tips for complementing other foods with seafood
The lysine strength (A+) of seafood means that it can complement well the protein of foods low in lysine, such as grains and certain nuts and seeds.
Tips for using dairy products to complement the protein in other foods
1.
Amino Acid
Makeup: dairy products have excellent amino acid ratings, as you would suppose from their high NPU scores. Thus they make good supplements to any food. But dairy products have notable amino acid strengths in isoleucine, and especially in lysine. These strengths can be used to advantage in combination with cereal grains (Protein
Table V
), which are low in both of these same amino acids. And it doesn’t take much! Only 2 tablespoons of nonfat dried milk added to 1 cup of wheat or rye flour increases the protein quality about 45 percent. Thus, bread with cheese, cheese-rice casseroles, and cereal with milk are all good protein mixes. These same amino acid strengths allow dairy products to complement the protein of nuts and seeds (Protein
Table IV
): sesame, peanuts, black walnuts, etc.
2. Experimentally determined complementary protein mixes include milk products:
plus Grains, for example:
Milk + Rice
Milk
+
Wheat
Milk + Corn
+
Soy
Milk
+
Wheat
+
Peanuts
plus Nuts and seeds, for example:
Milk
+
Peanuts
Milk +
Sesame
plus Legumes, for example:
Milk
+
Beans
plus Potatoes:
Milk
+
Potatoes