Read iOS Programming: The Big Nerd Ranch Guide, 3/e (Big Nerd Ranch Guides) Online
Authors: Aaron Hillegass,Joe Conway
Tags: #COM051370, #Big Nerd Ranch Guides, #iPhone / iPad Programming
iOS Programming: The Big Nerd Ranch Guide, 3/e (Big Nerd Ranch Guides) (70 page)

The static analyzer is useful for catching issues that can be recognized at compile time. However, some problems can’t be recognized until runtime. This is where
Instruments
excels. The
Instruments
tool monitors your application while it is running and can find real issues as they are happening.
Instruments
is made up of several plug-ins that enable you to inspect things like what objects are allocated, where the CPU is spending its time, file I/O, network I/O, and others. Each plug-in is known as an
Instrument
. Together, they help you track down inefficiencies in your application and optimize your code.
When you use
Instruments
to monitor your application, you are
profiling
the application. While you can profile the application running on the simulator, you will get more accurate data on a device.
The
Allocations
instrument tells us about every object that has been created and how much memory it takes up.
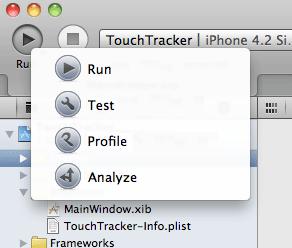
To profile an application, click and hold the
Run
button in the top left corner of the workspace. In the pop-up menu that appears, select
Profile
(
Figure 21.4
).
Figure 21.4 Profiling an application
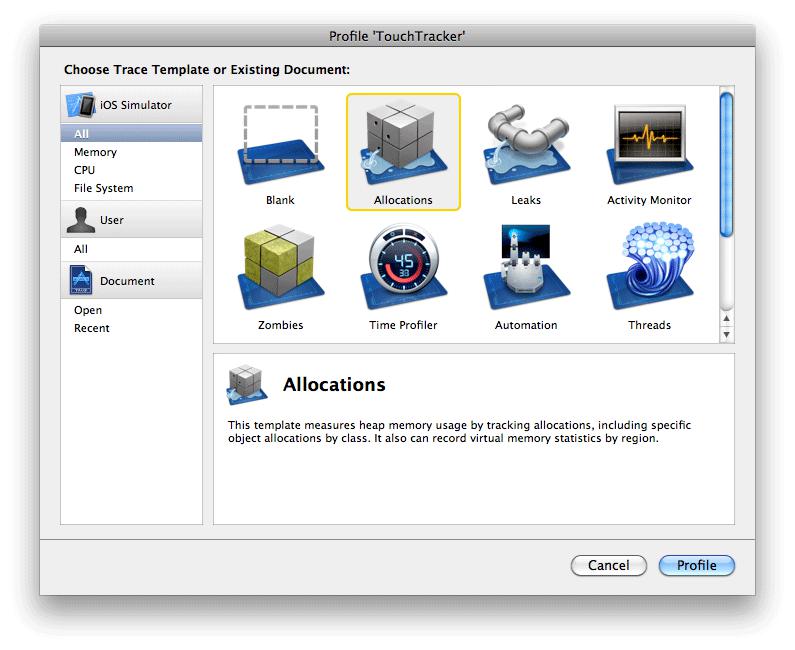
Instruments
will launch and ask which instrument to use. Choose
Allocations
and click
Profile
.
Figure 21.5 Choosing an instrument
TouchTracker
will launch, and a window will open in
Instruments
(
Figure 21.6
). The interface may be overwhelming at first, but, like
Xcode
’s workspace window, it will become familiar with time and use. First, make sure you can see everything by turning on all of the areas in the window. In the
View
control at the top of the window, click all three buttons to reveal the three main areas. The window should look like
Figure 21.6
.
Figure 21.6 Allocations instrument
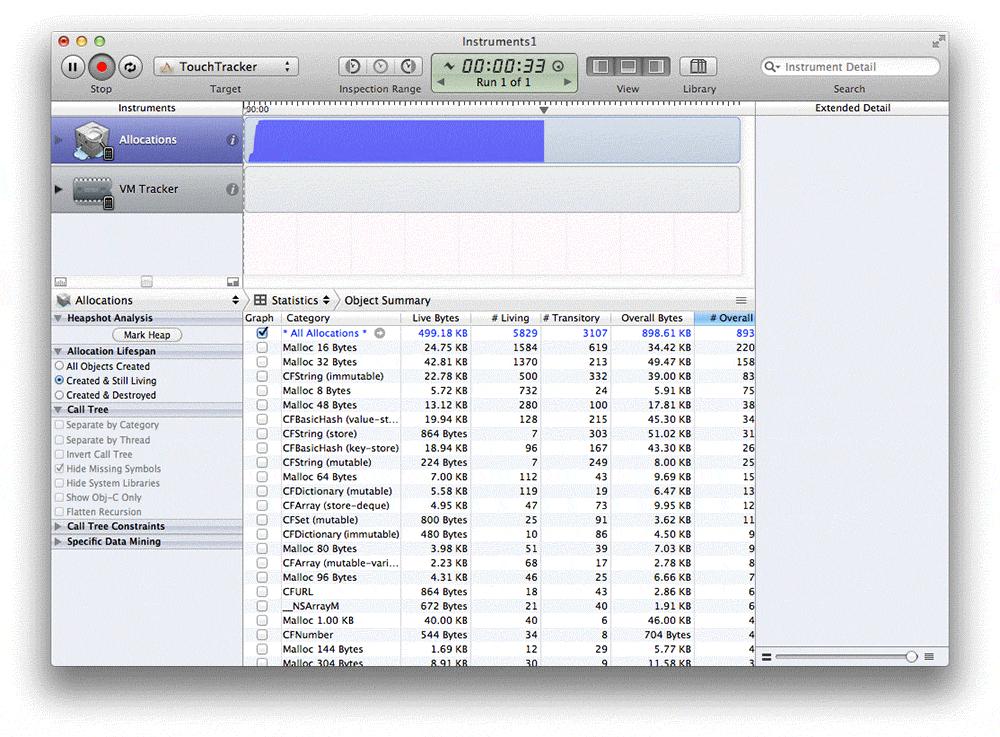
This table shows every memory allocation in the application. There are a lot of objects here, but let’s look at the objects that your code is responsible for creating. First, draw some lines in
TouchTracker
. Then, type
Line
in the
Instrument Detail
search box in the top right corner of the window.
This will filter the list of objects in the
Object Summary
table so that it only shows instances of
Line
(
Figure 21.7
).
Figure 21.7 Allocated Lines

The
# Living
column shows you how many line objects are currently allocated.
Live Bytes
shows how much memory these living instances take up. The
# Overall
column shows you how many lines have been created during the course of the application – even if they have since been deallocated.
As you would expect, the number of lines living and the number of lines overall are equal at the moment. Now double-tap the screen in
TouchTracker
and erase your lines. In
Instruments
, notice that the
Line
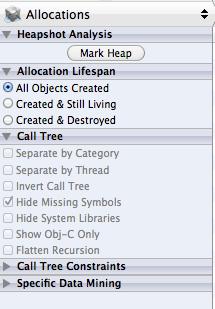
instances disappear from the table. The
Allocations
instrument is currently set to show only objects that are created and still living. To change this, select
All Objects Created
from the
Allocation Lifespan
section of the lefthand panel (
Figure 21.8
).
Figure 21.8 Allocations options
Let’s see what else the
Allocations
instrument can tell us about our lines. In the table, select the row that says
Line
. An arrow will appear in the
Category
column; click that arrow to see more details about these allocations (
Figure 21.9
).
Figure 21.9 Line summary
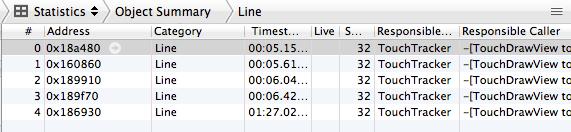
Each row in this table shows a single instance of
Line
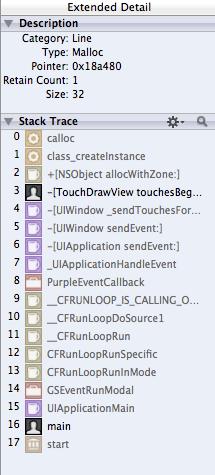
that has been created. Select one of the rows and check out the stack trace that appears in the
Extended Detail
area on the right side of the
Instruments
window (
Figure 21.10
). This stack trace shows you where that instance of
Line
was created. Grayed-out items in the trace are system library calls. Items in black text are your code. Find the top-most item that is your code (
-[TouchDrawView touchesBegan:withEvent:]
) and double-click it.
Figure 21.10 Stack trace
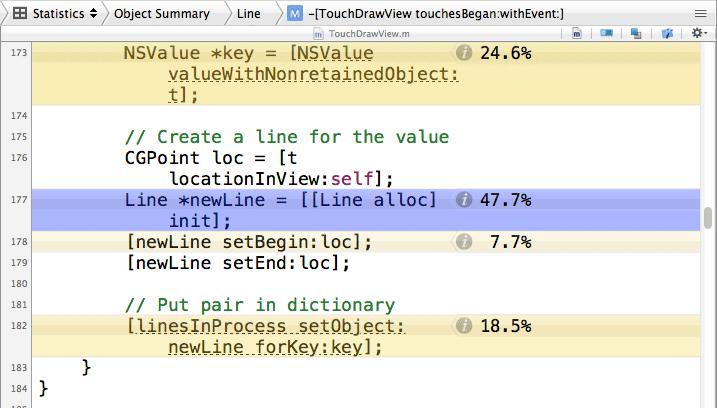
The source code for this implementation will replace the table of
Line
instances (
Figure 21.11
). The percentages you see are the amount of memory these method calls allocate compared to the other calls in this method. For example, the
Line
instance makes up about 47 percent of the memory allocated by
touchesBegan:withEvent:
.
Figure 21.11 Source code in Instruments
Notice that above the summary area is a breadcrumb navigation bar (
Figure 21.12
). You can click on an item in this bar to return to a previous set of information.
Figure 21.12 Navigation for summary area
