More Guns Less Crime (11 page)
Read More Guns Less Crime Online
Authors: John R. Lott Jr
Tags: #gun control; second amendment; guns; crime; violence

The effect of gun ownership by women deserves a special comment. Despite the relatively small number of women who obtain concealed-handgun permits, the concealed-handgun coefficient for explaining rapes in the first three sets of results is consistently similar in size to the effect that this variable has on other violent crime. January 1996 data for Washington and Oregon reveal that women constituted 18.6 and 22.9 percent, respectively, of those with concealed-handgun permits. 22 The set of women who were the most likely targets of rape probably chose to carry concealed handguns at much higher rates than women in general. The preceding results show that rapists are particularly deterred by handguns. As mentioned earlier, the National Crime Victimization Survey data show that providing a woman with a gun has a much greater effect on her ability to defend herself against a crime than providing a gun to a man. Thus even if few women carry handguns, the change in the "cost" of attacking women could still be as great as the change in the "cost" of attacking men, despite the much higher number of men who are becoming armed. To phrase this differently, if one more woman carries a handgun, the extra protection for women in general is greater than the extra protection for men if one more man carries a handgun. 23
These results raise a possible concern as to whether women have the right incentive to carry concealed handguns. Despite the fact that women who carry concealed handguns make other women so much safer, it is possible that women might decide not to carry them because they see their own personal gain as much smaller than the total benefit to all women that carrying a concealed handgun produces. While the problem is particularly pronounced for women, people in general often take into account only the benefits that they individually receive from carrying a gun and not the crime-reduction benefits that they are generating for others. 24
As mentioned in chapter 2, an important concern is that passing a nondiscretionary concealed-handgun law should not affect all counties equally. In particular, when states had discretionary laws, counties with the highest populations were also those that most severely restricted people's ability to carry concealed weapons. Adopting nondiscretionary laws therefore produced the greatest change in the number of permits in the more populous counties. Thus, a significant advantage of using this
CONCEALED-HANDGUN LAWS AND CRIME RATES/63
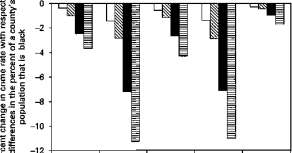
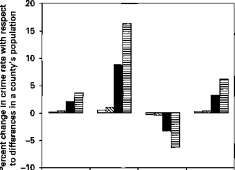
county data is that it allows us to take advantage of county-level variation in the impact of nondiscretionary concealed-handgun laws. To test this variation across counties, figures 4.1 and 4.2 repeat all the specifications in table 4.1 but examine instead whether the effect of the nondiscretionary law varies with county population or population density. (The simplest way to do this is to multiply the nondiscretionary-law variable by either the county population or population density.) While all the other coefficients remain virtually unchanged, this new interaction implies the same crime-reducing effects from the nondiscretionary law as reported earlier. In all but one case the coefficients are more significant and larger.
The coefficients are consistent with the hypothesis that the new laws induce the greatest changes in the largest counties, which have a much greater response in both directions to changes in the laws. Violent crimes fall more and property crimes rise more in the largest counties. The figures indicate how these effects vary for counties of different sizes. For example, when counties with almost 600,000 people (two standard deviations above the mean population) pass a concealed-handgun law, the murder rate falls by 12 percent. That is 7.4 times more than it was reduced for the average county (75,773 people).
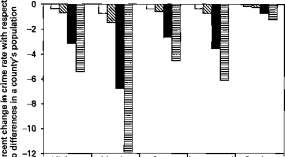
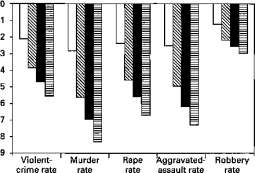
Although the law-enforcement officials that I talked to continually mentioned population as being the key variable, I also reexamined whether the laws had different effects in more densely populated counties. Given the close relationship between county population and population density, it is not too surprising to find that the impact of concealed handguns in more densely populated areas is similar to their impact in more populous counties. The most densely populated areas are the ones most helped by concealed-handgun laws. Passing a concealed-handgun law lowers the murder rate in counties with about 3,000 people per square mile (the levels found in Fairfax, Virginia; Orleans, Louisiana, which contains New Orleans; and Ramsey, Minnesota, which contains St. Paul) by 8.5 percent, 12 times more than it lowers murders in the average county. The only real difference between the results for population and population density occur for the burglary rate, where concealed-handgun laws are associated with a small reduction in burglaries for the most densely populated areas.
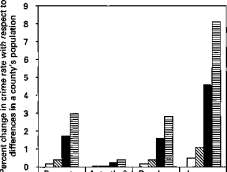
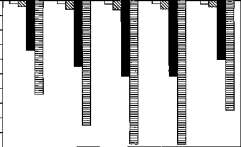
Figures 4.3 and 4.4 provide a similar breakdown by income and by the percentage of the population that is black. Higher-income areas and counties with relatively more blacks both have particularly large drops in crime associated with concealed-handgun laws. Counties with a 37 percent black population experienced 11 percent declines in both murder and aggravated assaults. The differences with respect to income were not as large. 25
Q_
Violent- Murder Rape Aggravated- Robbery
crime rate
rate
rate assault rate
rate
A. Violent-crime categories
LJ 1/2 Mean population (37,887)
fc£l Mean population (75,773)
I Mean population plus one standard deviation (326,123)
I Mean population plus two standard deviations (576,474)
Property- Auto-theft Burglary
crime rate
rate
rate
Larceny rate
B. Property-crime categories
I I 1/2 Mean population
(37,887)
Istt Mean population (75,773)
I Mean population plus one standard deviation (326,123)
3 Mean population plus two standard deviations (576,474)
Figure 4.1. Do larger changes in crime rates from nondiscretionary concealed-handgun laws occur in more populous counties?
n
& o
III
0 1- 4-> O) © TO
O (0
0 -1 -2 -3 -4 -5 -6 -7 -8 -9 -10
Violent- Murder Rape Aggravated- Robbery
crime rate rate rate assault rate rate
A. Violent-crime categories
I I 1/2 Mean population
(107.2)
Isa Mean population (214.3)
I Mean population plus one standard deviation (1,635.6)
1 Mean population plus two standard deviations (3,056.8)
Property- Auto-theft Burglary Larceny
crime rate
rate
rate
rate
B. Property-crime categories
I I 1/2 Mean population
(107.2)
fcSl Mean population (214.3)
I Mean population plus one standard deviation (1,635.6)
1 Mean population plus two standard deviations (3,056.8)
Figure 4.2. Do larger changes in crime rates from nondiscretionary concealed-handgun laws occur in more densely populated counties?
8 V
• £: •if
c§
COT _ fll
a! o
Aggravated- Robbery assault rate
A. Violent-crime categories
I I 1 /2 Mean per-capita
income ($5,277)
£a Mean per-capita income ($10,554)
I Mean per-capita income plus one standard deviation ($13,052)
1 Mean per-capita income plus two standard deviations ($15,550)
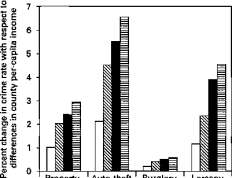
Property- Auto-theft Burglary Larceny crime rate rate rate rate
B. Property-crime categories
I I 1/2 Mean per-capita
income ($5,277)
^ Mean per-capita income ($10,554)
I Mean per-capita income plus one standard deviation ($13,052)
I Mean per-capita income plus two standard deviations ($15,550)
Figure 4.3. How does the change in crime from nondiscretionary concealed-handgun laws vary with county per-capita income?