More Guns Less Crime (22 page)
Read More Guns Less Crime Online
Authors: John R. Lott Jr
Tags: #gun control; second amendment; guns; crime; violence

Years before and after the adoption of the law
Figure 7.3. The effect of concealed-handgun laws on rapes, using Black's and Nagin's "full sample"
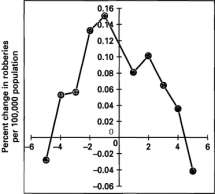
Years before and after the adoption of the law
Figure 7.4. The effect of concealed-handgun laws on robbery, using Black's and Nagin's "full sample"
They claim that their results differ from ours because they find a statistically significant decline. This is puzzling; it is difficult to see why their results would be viewed as inconsistent with my argument. I had indeed also found some evidence that larcenies were reduced by nondiscretion-ary laws (for example, see the results using the state-level data or the results using two-stage least squares), but I chose to emphasize those results implying the smallest possible positive benefits from concealed-handgun laws.
Years before and after the adoption of the law
Figure 7.5. The effect of concealed-handgun laws on aggravated assaults, using Black's and Nagin's "full sample"
The bottom line—even using their choice of the dates that they deem most appropriate—is that murder and robbery rates fall after the passage of the laws and that none of the other violent-crime categories experienced an increase. Looking further at whether violent-crime rates were rising or falling before and after these laws, one finds that violent-crime rates were almost always rising prior to the passage of the law and always falling after it.
8 The impact of including Florida in the sample
Our concern is particularly severe for the state of Florida. With the Mariel boat lift of 1980 and the thriving drug trade, Florida's crime rates are quite volatile. Moreover, four years after the passage of the right-to-carry law in 1987, Florida passed several gun-related measures, including background checks of handgun buyers and a waiting period for handgun purchases. To test the sensitivity of the results to the inclusion of Florida, we reestim-ated the model... without Florida. Only in the robbery equation can we reject the hypothesis that the crime rate two and three years after adoptions is different than the crime rate two and three years prior to adoption. (Dan Black and Daniel Nagin, "Do 'Right-to-Carry' Laws Deter Violent Crime?" Carnegie-Mellon University working paper, October 16,1996, p. 9)
THE POLITICAL AND ACADEMIC DEBATE/139
In fact, Nagin and Black said they found that virtually all of the claimed benefits of carry laws were attributable to changes in the crime rate in just one state: Florida. (Richard Morin, "Unconventional Wisdom: New facts and Hot Stats from the Social Sciences," Washington Post, March 23, 1997, p. C5)
This particular suggestion—that we should throw out the data for Florida because the drop in violent crimes is so large that it affects the results—is very ironic. Handgun Control, Inc. and other gun-control groups continue, as of this writing, to cite the 1995 University of Maryland study, which claimed that if evidence existed of a detrimental impact of concealed handguns, it was for Florida. 26 If the Maryland study is to be believed, the inclusion of Florida must have biased my results in the opposite direction. 27
More important, as we shall see below, the reasons given by Black and Nagin for dropping Florida from the sample are simply not valid. Furthermore, the impact of excluding Florida is different from what they claim. Figure 7.6 shows the murder rate in Florida from the early 1980s until 1992. The Mariel boat lift did dramatically raise violent-crime rates like murder, but these rates had returned to their pre-Mariel levels by 1982. For murder, the rate was extremely stable until the nondiscretion-ary concealed-handgun law passed there in 1987, when it began to drop dramatically.
The claim that Florida should be removed from the data because a
Years before and after Implementation of the law Figure 7.6. Florida's murder rates
140/CHAPTER SEVEN
waiting period and a background check went into effect in 1992 is even weaker. If this were a valid reason for exclusion, why not exclude other states with these laws as well? Why only remove Florida? Seventeen other states had waiting periods in 1992. A more valid response would be to try to account for the impact of these other laws—as I did in chapter 4. Indeed, accounting for these other laws slightly strengthens the evidence that concealed handguns deter crime.
The graph for Florida in figure 7.6 produces other interesting results. The murder rate declined in each consecutive year following the implementation of the concealed-handgun law until 1992, the first year that these other, much-touted, gun-control laws went into effect. I am not claiming that these laws caused murder rates to rise, but this graph surely makes it more difficult to argue that laws restricting the ability of law-abiding citizens to obtain guns would reduce crime.
While Black's and Nagin's explanations for dropping Florida from the data set are invalid, there is some justification for concern that results are being driven by a few unusual observations. Figure 7.7 shows the relationship between violent-crime rates and concealed-handgun laws when
-6-4-2 0 2 4 6
Years before and after adoption of the law
Figure 7.7. The effect of concealed-handgun laws on violent crimes, excluding Florida
THE POLITICAL AND ACADEMIC DEBATE/141
Florida is excluded. A careful comparison of this graph with that of figure 4.5, which includes Florida, reveals only a few very small differences.
As a more systematic response to this concern, I excluded Florida and reestimated all the regressions shown in this book. Indeed, there were eight regressions out of the more than one thousand discussed in which the exclusion of Florida did cause the coefficient for the nondiscretionary variable to lose its statistical significance, although it remained negative. The rest of the regression estimates either remained unchanged or (especially for aggravated assault and robbery) became larger and more statistically significant.
Black and Nagin seem to feel that their role in this debate is to see if they can find some specification using any combination of the data that weakens the results. 28 But traditional statistical tests of significance are based on the assumption that the researcher is not deliberately choosing which results to present. Even if a result is statistically significant at the 1 percent level, one would expect that one out of every one hundred regressions would not yield a statistically significant result; in other words, out of one thousand regressions, one would expect to find at least ten for which the impact of nondiscretionary concealed-handgun laws was not statistically significant.
Lott's claims that Florida's concealed-carry law was responsible for lower murder rates in that state is questionable. Florida did not experience reductions in murders and rapes until four or five years after the law was liberalized. Lott attributes this "delayed effect" to the cumulative influence of increases in carrying permits. Other research attributes Florida's declines in murders in the 1990s to laws requiring background checks and waiting periods for handgun purchases that were implemented several years after gun-carrying laws were liberalized. (Webster, "Flawed")
Much of Webster's comment echoes the issues raised previously by Black and Nagin—indeed, I assume that he is referring to their piece when he mentions "other research." However, while I have tested whether other gun-control laws might explain these declines in crime (see table 4.11), Black and Nagin did not do so, but merely appealed to "other research" to support their affirmation. The preceding quotation seems to imply that my argument involved some sort of "tipping" point: as the number of permits rose, the murder rate eventually declined. As figure 7.6 illustrates, however, Florida's decline in murder rates corresponded closely with the rise in concealed-handgun permits: no lag appears in the decline; rather, the decline begins as soon as the law goes into effect.
9 The impact of including Maine in the sample
One should also be wary of the impact that Maine has on Lott's graphs.... When Maine was removed from the analyses, the suggested delayed [effects of the law] on robberies and aggravated assaults vanished. (Webster, "Flawed")
This comment is curious not only because Mr. Webster does not cite a study to justify this claim but also because he has never asked for the data to examine these questions himself. Thus it is difficult to know how he arrived at this conclusion. A more direct response, however, is simply to show how the graphs change when Maine is excluded from the sample. As figures 7.8 and 7.9 show, the exclusion of Maine has very little effect.
10 How much does the impact of these laws vary across states?
[Dan Black and Dan Nagin] found the annual murder rate did go down in six of the ten states—but it went up in the other four, including a 100 percent increase in West Virginia. Rape dropped in five states—but increased in the other five. And the robbery rate went down in six states— but went up in four. "That's curious," Black said. If concealed weapons laws were really so beneficial, their impact should not be so "wildly" different from state to state. (Richard Morin, "Unconventional Wisdom: New Facts and Hot Stats from the Social Sciences," Washington Post, March 23, 1997, p. C5)
Unfortunately, Black's and Nagin's evidence was not based on statewide crime rates but on the crime rates for counties with over 100,000 people.
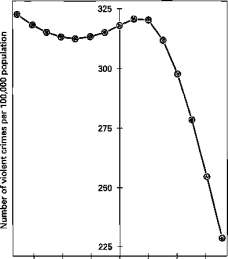
-6-4-2 0 2 4 6
Years before and after adoption of the law
Figure 7.8. The effect of concealed-handgun laws on robbery rates, excluding Maine
THE POLITICAL AND ACADEMIC DEBATE/143
a o a o o o
-8-6-4-202468 Years before and after adoption of the law
Figure 7.9. The effect of concealed-handgun laws on aggravated assaults, excluding Maine
This fact is important, for instance, in West Virginia, where it means that only one single county —Kanawha—was examined. The other fifty-four counties in West Virginia, which include 89 percent of the state's population, were excluded from their estimates. They used only one county for three of the ten states, and only three counties for another state. In fact, Black and Nagin managed to eliminate 85 percent of all counties in the nation in their analysis.
As shown in table 4.9 (see chapter 4), my estimates using all the counties certainly did not yield "wildly" different estimates across states. Violent-crime rates fell in nine of the ten states enacting new nondiscre-tionary concealed-handgun laws between 1977 and 1992. The differences that did exist across states can be explained by differences in the rates at which concealed-handgun permits were issued. Table 4.10 also provides evidence that the states that issued more permits experienced greater reductions in crime.
11 Do the coefficient estimates for the demographic variables make sense?
Perhaps even more surprising are the coefficient estimates for measures of a county's population that is black, female, and between the ages of 40 and 49 or over the age of 65. [Lott and Mustard find] evidence to suggest that these variables have a statistically significant, positive correlation with
144/CHAPTER SEVEN
murder rates ... and that black females ages 40 to 49 have a statistically
significant positive correlation with the aggravated assault rate There
remain two competing explanations for [these] findings. First, middle-aged and elderly African-American women could be actively [engaged] in the commission of car thefts, assaults, and murders across the United States. The more likely explanation is that [their results] are misspecified and, as a result, their coefficient estimates are biased. (Ludwig, "Permissive Concealed-Carry Laws," pp. 20-21. See also Albert W. Alschuler, "Two Guns, Four Guns, Six Guns, More: Does Arming the Pubic Reduce Crime?" Valparaiso University Law Review 31 (Spring 1997): 367.)
No, black females ages 40 to 49 are not responsible for a crime wave. Other results in the regressions that were not mentioned in this quotation indicate that the greater the percentage of women between the ages of 10 and 29, the greater the rape rate—but these estimates do not imply that young women are going out and committing rapes. To show that crime rates are higher where greater percentages of the population are of a certain demographic age group does not imply that the people in that group are committing the crimes. The positive relationship may exist because these people are relatively easy or attractive victims.