Read The 80/20 Principle: The Secret of Achieving More With Less Online
Authors: Richard Koch
Tags: #Non-Fiction, #Psychology, #Self Help, #Business, #Philosophy
The 80/20 Principle: The Secret of Achieving More With Less (6 page)

We look first at 80/20 Analysis and then at 80/20 Thinking.
80/20 ANALYSIS
80/20 Analysis examines the relationship between two sets of comparable data. One set of data is always a universe of people or objects, usually a large number of 100 or more, that can be turned into a percentage. The other set of data relates to some interesting characteristic of the people or objects that can be measured and also turned into a percentage.
For example, we might decide to look at a group of 100 friends, all of whom are at least occasional beer drinkers, and compare how much beer they drank last week.
So far, this method of analysis is common to many statistical techniques. What makes 80/20 Analysis unique is that the measurement ranks the second set of data in descending order of importance and makes comparisons between percentages in the two sets of data.
In our example, then, we will ask all our 100 friends how many glasses of beer they drank last week and array the answers in a table in descending order. Figure 6 shows the top 20 and bottom 20 from the table.
80/20 Analysis can compare percentages from the two sets of data (the friends and the amount of beer drunk). In this case, we can say that 70 percent of the beer was drunk by just 20 percent of the friends. This would therefore give us a 70/20 relationship. Figure 7 introduces an 80/20 frequency distribution chart (or 80/20 chart for short) to summarize the data visually.
Why is this called 80/20 Analysis?
When comparing these relationships, the most frequent observation, made long ago (probably in the 1950s), was that 80 percent of the quantity being measured came from 20 percent of the people or objects. 80/20 has become shorthand for this type of unbalanced relationship, whether or not the precise result is 80/20 (statistically, an exact 80/20 relationship is unlikely). It is the convention of 80/20 that it is the
top
20 percent of causes that is cited, not the bottom. 80/20 Analysis is my name for the way that the 80/20 Principle has generally been used to date, that is, in a quantitative and empirical way, to measure possible relationships between inputs and outputs.
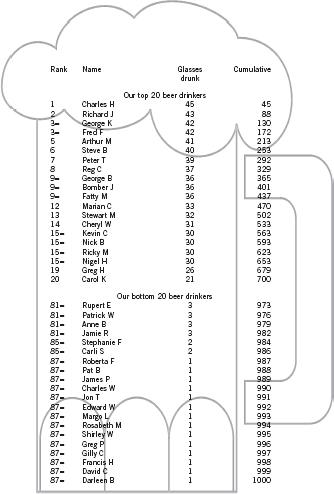
Figure 6 The 80/20 Principle applied to beer drinkers

Figure 7 80/20 frequency distribution chart of beer drinkers
We could equally well observe from the data on our beer-drinking friends that the bottom 20 percent of people only consumed 30 glasses, or 3 percent of the total. It would also be perfectly legitimate to call this a 3/20 relationship, although this is rarely done. The emphasis is nearly always on the heavy users or causes. If a brewery was conducting a promotion or wanted to find out what beer drinkers thought about their range of beers, it would be most useful to go to the top 20.
We might also want to know what percentage of our friends combined to account for 80 percent of total beer consumption. In this case, inspection of the part of the table not displayed (the middle part) would show that Mike G, the 28th biggest drinker with 10 glasses, took the cumulative total to 800 glasses. We could express this relationship, therefore, as 80/28: 80 percent of total beer was drunk by just 28 percent of our friends.
It should be clear from this example that 80/20 Analysis may result in any set of findings. Clearly, individual findings are more interesting and potentially more useful where there is an imbalance. If, for example, we had found that all of our friends had drunk exactly eight glasses each, the brewery would not have been very interested in using our group for a promotion or research. In this case, we would have had a 20/20 relationship (20 percent of beer was drunk by the “top” 20 percent of friends) or an 80/80 relationship (80 percent of beer was drunk by 80 percent of friends).
Bar charts show 80/20 relationships best
An 80/20 Analysis is best displayed pictorially, by looking at two bars—as is particularly appropriate for our example! (Figures 2–4 above were bar charts.) The first bar in Figure 8 contains our 100 beer-drinking friends, each filling 1 percent of the space, starting with the biggest beer drinker at the top and ending with the smallest beer drinkers at the bottom. The second bar contains the total amount of beer drunk by each (and all) of our friends. At any point, we can see for a given percentage of our friends how much beer they accounted for.

Figure 8 Beer / beer drinking ratios

Figure 9 Beer / beer drinking ratios
Figure 8 shows what we discovered from the table (and could also see from Figure 7): the top 20 percent of beer drinkers accounted for 70 percent of the beer drunk. The simple bars in Figure 8 take the data from Figure 7 and display them from top to bottom instead of from left to right. It doesn’t matter which display you prefer.
If we wanted to illustrate what percentage of our friends drank 80 percent of the beer we would draw the bar charts slightly differently, as in Figure 9, to show the 80/28 relationship: 28 percent of our friends drank 80 percent of the beer.
What is 80/20 Analysis used for?
Generally, to change the relationship it describes, or to make better use of it!
One use is to concentrate on the key causes of the relationship, the 20 percent of inputs that lead to 80 percent (or whatever the precise number is) of the outputs. If the top 20 percent of beer drinkers account for 70 percent of beer consumed, this is the group that a brewery should concentrate on reaching, in order to attract as high a share as possible of the business from the 20 percent, and possibly also to increase their beer consumption still further. For all practical purposes, the brewery may decide to ignore the 80 percent of beer drinkers who only consume 30 percent of the beer; this simplifies the task immensely.
Similarly, a firm that finds that 80 percent of its profits come from 20 percent of its customers should use this information to concentrate on keeping that 20 percent happy and increasing the business carried out with them. This is much easier, as well as more rewarding, than paying equal attention to the whole customer group. Or, if the firm finds that 80 percent of its profits come from 20 percent of its products, it should put most of its efforts behind selling more of those products.
The same idea applies to nonbusiness applications of 80/20 Analysis. If you analyzed the enjoyment you derived from all your leisure activities and found that 80 percent of the enjoyment derived from 20 percent of the activities, which currently took only 20 percent of your leisure time, it would make sense to increase the time allocation from 20 to at least 80 percent.
Take transport as another example. 80 percent of traffic jams occur on 20 percent of roads. If you drive on the same route to work each day, you will know that roughly 80 percent of delays usually occur at 20 percent of the intersections. A sensible reaction would be for traffic authorities to pay particular attention to traffic phasing on those 20 percent of jam-creating intersections. While the expense of such phasing might be too much for 100 percent of junctions 100 percent of the time, it would be money well spent in the key 20 percent of locations for 20 percent of the day.
The second main use of 80/20 Analysis is to do something about the “underperforming” 80 percent of inputs that contribute only 20 percent of the output. Perhaps the occasional beer drinkers can be persuaded to drink more, for example by providing a blander product. Perhaps you could work out ways to get greater enjoyment out of the “underperforming” leisure activities. In education, interactive teaching systems now replicate the technique used by college professors where questions are addressed randomly to any student, in order to combat the 80/20 rule, where 80 percent of classroom participation comes from 20 percent of the trainees. In U.S. shopping malls it has been found that women (some 50 percent of the population) account for 70 percent of the dollar value of all purchases.
4
One way to increase the 30 percent of sales to men might be to build stores specifically designed for them. Although this second application of 80/20 Analysis is sometimes very useful and has been put to great effect in industry in improving the productivity of underperforming factories, it is generally harder work and less rewarding than the first use.
Don’t apply 80/20 Analysis in a linear way
In discussing the uses of 80/20 Analysis, we must also briefly address its potential abuses. Like any simple and effective tool, 80/20 Analysis can also be misunderstood, misapplied, and, instead of being the means to an unusual insight, serve as the justification for conventional thuggery. 80/20 Analysis, applied inappropriately and in a linear way, can also lead the innocent astray—you need constantly to be vigilant against false logic.
Let me illustrate this with an example from my own new profession, the book trade. It is easy to demonstrate that, in most times and places, about 20 percent of book titles comprise about 80 percent of books sold. For those who are steeped in the 80/20 Principle, this is not surprising. It might seem a short hop to the conclusion that bookshops should cut the range of books they stock or, indeed, that they should concentrate largely or exclusively on “bestsellers.” Yet what is interesting is that in most cases, instead of sending profits up, restricting range has sent profits down.
This does not invalidate the 80/20 Principle, for two reasons. The key consideration is not the distribution of books sold, but what customers want. If customers go to the trouble of visiting a bookstore, they want to find a reasonable range of books (as opposed to a kiosk or supermarket, where they don’t expect range). Bookstores should concentrate on the 20 percent of customers who account for 80 percent of their profits and find out what those 20 percent of customers want.