The Norm Chronicles (27 page)
Read The Norm Chronicles Online
Authors: Michael Blastland

But should it? You might argue with this. You might prefer to put off facing up to your lifestyle risks. You might argue that you shouldn’t be confronted with the payback until it actually occurs, late in life. On the other hand, it could be argued that the damage is done now, at the point of consumption, so we should measure it now.
MicroLives allow us to make simple comparisons of chronic risk, just as we did for acute risk with MicroMorts. Now we can compare
sausages with drinking or smoking, X-rays with mobile phones. We can compare a CT scan with watching the Hiroshima atomic bomb from the Hiroshima suburbs, getting fat with getting fit, unprotected sex with unprotected sun – and we will. In
Chapter 27
,
Figure 37
shows a selection of MicroLife hazards.
If calculations terrify you, move swiftly on to the next chapter. Because next, we’ll find out exactly how these calculations are done and what the evidence is for the MicroLife costs and benefits we’ve identified. Treat it as a statistical detective story.
We begin with the 1 ML cost of an extra burger every day, mentioned earlier. This was reported in the
Daily Express
in a story about the dangers of red meat, based on a study from Harvard University.
1
The
Express
said: ‘If people cut down the amount of red meat they ate – say from steaks and beefburgers – to less than half a serving a day, 10 per cent of all deaths could be avoided.’
Oh to be one of the 10 per cent for whom death could be avoided! But this is not what the study said. Its main conclusion was that an extra portion of red meat a day – this being a lump of meat around the size of a pack of cards or slightly smaller than a standard quarter-pound burger
*
– is associated with a ‘hazard ratio’ of 1.13: that is, a 13 per cent increased risk of death. Put aside any doubts about the validity of this number for a moment and take it at face value. What does it mean? When our risk of death is already 100 per cent, surely a risk of 113 per cent is an exaggeration?
Let’s consider two friends – whom we’ll call Kelvin and Norm – who are both aged 40, and just for the moment let’s make the unrealistic assumption that they are pretty much alike in most lifestyle respects that matter, apart from the amount of meat they eat.
†
Carnivorous Kelv eats a quarter-pound burger for lunch from Monday to Friday, while Normal Norm does not eat meat for weekday lunches, but otherwise has a similar diet to Kelvin’s. We are not concerned here with their friend Particular Pru, who has given up eat meat and turned veggie after reading the
Daily Express
, but who might succumb to a contaminated sprouted fenugreek seed.
Each person faces an annual risk of death, the technical name for which is their ‘hazard’ or, somewhat archaically but poetically, their ‘force of mortality’ (for a fuller discussion of the force of mortality, see
Chapter 26
, ‘The End’). A ‘hazard ratio’ of 1.13 means that, for two people like Kelvin and Norm, similar apart from the extra meat, the one with the risk factor – Kelvin – has a 13 per cent increased
annual
risk of death – not an overall risk, obviously – during a follow-up period of around 20 years.
This does not imply that his life will be 13 per cent shorter. To work out what it really means we have to go to the life-tables provided by the Office of National Statistics. These tell us the risk that an average man – Norm, say – will die at each year of age. In 2010 this risk or hazard was at its lowest for those aged seven (see
Chapter 2
, on infancy), at 1 in 10,000: it then rises to 1 in 1,000 at age 34, then to 1 in 100 at age 62, until at age 85, 1 in 10 will die before their 86th birthday. So very roughly the annual chance of death increases tenfold around every 27 years, which works out at doubling every nine years, or about a 9 per cent extra risk of dying before the next 12 months are out, for every year that we are older. The tables also tell us life-expectancy at any given age, assuming the current hazards, and, having survived to age 40, Norm is expected to live a further 40 years, until he is 80.
From this we can work out Carnivorous Kelv’s prospects by multiplying all Norm’s hazards by 1.13. After a little work in a spreadsheet, we find that Kelvin can expect to live 39 more years on average, a year less than Norm. So Kelvin’s lunch – if he eats the same lunch all his life and if we believe this hazard ratio – is associated with the loss of one year in expected age at death, from 80 to 79.
Is that a lot? Kingsley Amis said, ‘No pleasure is worth giving up for the sake of two more years in a geriatric home at Weston-super-Mare.’
2
It is for readers to decide. But we cannot say that precisely this amount of
time will be lost. We cannot even be very confident that Kelvin will die first. In fact, there is only a 53 per cent chance
*
that Kelvin will die before Norm, rather than 50:50 if they eat the same lunch. Not a big effect.
But it sounds rather more important if we say that this lost year (1/40th of the remaining life) translates very roughly to one week a year, or roughly half an hour a day. So one extra MicroLife burned up for each daily burger. So, unless you’re a very slow eater, you expect to lose more life than the time it takes to eat your burger.
But we can’t even say the meat is directly causing the loss in life-expectancy, in the sense that, if Kelvin changed his lunch habits and stopped shovelling down the burgers, his life-expectancy would definitely increase. Maybe there’s some other factor that both encourages Kelvin to eat more meat and leads to a shorter life.
Income could be such a factor – poorer people in the US tend to eat more burgers and also live shorter lives, even allowing for measurable risk factors. But the Harvard study does not adjust for income, arguing that the people in the study – health professionals and nurses – are broadly doing the same job. We think that many of these studies about diet should be taken with a pinch of salt (although perhaps not too much, since it may increase your risk of heart disease).
We can also look deeper into the calculation for other bad behaviours that receive a finger-wagging. So, next, smoking. The evidence against smoking is much better than that against red meat. In terms of shortening your life, a very basic analysis estimated a 6.5 years difference in life-expectancy between smokers and non-smokers, which is 3,418,560 minutes.
3
They considered median consumption of 16 cigarettes a day from ages 17 to 71, which comes to 311,688 cigarettes. Making the simplifying assumption that each cigarette contributes equally to the risk, this comes to 11 minutes loss in life-expectancy per cigarette, or around 3 cigarettes for a MicroLife.
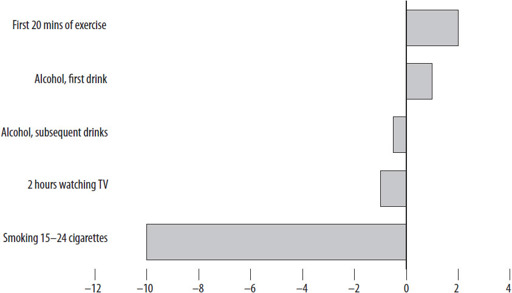
Figure 20:
Some MicroLives: how many gained or lost for different activities
This simple analysis only compares smokers with non-smokers, who may be different in all sorts of ways that could also influence their health. A more sophisticated analysis would consider the effect of stopping smoking, and fortunately that’s been done in a classic study on 40,000 UK doctors, many of whom gave up smoking during the period of the study from 1951 to 2001.
4
They estimate a 40-year-old man who stopped smoking gained 9 years in life-expectancy, or 78,000 hours in total, and from this we can estimate around 2 cigarettes for a MicroLife. So 2 ciggies is roughly equivalent to 1 burger, when taken daily.
*
So what about the booze? The precise effect of alcohol on all-cause mortality is controversial since, although it can cause accidents (particularly for drivers and young binge-drinkers), give you liver disease and increase the risk of some cancers, it can also protect your heart. So the ‘dose-response’ curve for annual risk is J-shaped in middle age, meaning
that the risk falls slightly with the curve of the ‘J’ as you consume a small amount of alcohol, then rises as you consume more. Very roughly, it looks like the first drink each day adds a MicroLife, but extra drinks take it away again, and more. So the first is medicine, the second poison, the third poison and so on. It does
not
go medicine/poison/medicine/poison … – that would be ridiculous, and would mean that one would need to have an odd number of drinks.
5
All this is depressing, but what about the benefits of a good diet and hearty exercise – eating muesli and running (although not at the same time)? As A. A. Milne said, ‘A bear, however hard he tries, grows tubby without exercise’, and we can try and work out what that tubbiness might do to your life. A recent review estimated a risk
*
which translates to around 1 ML lost for every day that you are 5 kg overweight.
6
Seriously obese people can lose ten years off their life-expectancy, similar to smokers.
The European Prospective Investigation into Cancer and Nutrition (EPIC) study in Norfolk compared people who ate their five portions of fruit and veg a day with those who didn’t (and the researchers checked their honesty about their diet by measuring vitamin C levels in their blood).
7
The hazard ratio was 0.69, showing around 30 per cent less annual risk associated with a better diet, or around 3 ML a day saved, as if they were only ageing 22.5 hours instead of 24.
And all that running around? The UK guidelines recommend we all take 30 minutes moderate or vigorous activity on five days each week – a total of 2.5 hours per week or 22 minutes a day. When asked in 2008 about their physical activity, 39 per cent of men and 29 per cent of women claimed they did this much exercise each week.
8
However exercise, like sex, tends to be over-reported, just as alcohol is under-reported – if we believed what people say they drank, half the alcohol bought in the UK must be left in the bottle or chucked down the sink.
Which we doubt. When people carry accelerometers that measure their true exercise, only 6 per cent of men and 4 per cent of women meet the government-recommended levels of activity. We are part of a population that is both tubby
and
deluded.
A huge review of 22 studies involving nearly 1 million people concluded that 2.5 hours a week of ‘non-vigorous’ activity was associated with a hazard ratio of 0.81 compared with being a complete slob – a 19 per cent reduction in annual risk of death.
9
This works out as about an hour per day, or 2 ML, added to life-expectancy for an average of 22-minutes-a-day activity, which must be why that’s the length of Norm’s run – quite a good return for the investment of getting off the sofa.
So it’s a good idea not to be a couch potato, and a Swedish study even showed that it’s never too late to start, with increasing physical activity in middle age eventually bringing your risk down to the level of people who have always been active – similar to the benefits of giving up smoking.
10
Some naive extrapolation would suggest that if we do lots of exercise we could live for ever, but sadly there is a strong law of diminishing returns. People who do 7 hours moderate exercise a week, a full hour per day, only reduced their risk by 24 per cent, equivalent to about 1.5 hours added to their life for each day of exercise.
So, very roughly, compared with doing no physical activity, the first 20 minutes or so per day pays rich dividends, but any more than that is approximately pro rata: 20 minutes of exercise earns you 20 minutes of added life-expectancy. It’s like time stops for you when you’re exercising. And on a treadmill it can certainly feel that way.
Our circumstances when we’re born – which we can’t do much about – can also be expressed in MicroLives. For example, being female rather than male (worth an extra 4 ML, or two hours per day), being Swedish rather than Russian (21 a day for males, or more than ten extra hours) and living in 2010 rather than 1910 (15 a day, or 7.5 extra hours).
Of course, working out the health effects of lifestyle is not a precise art. It is impossible to put exact numbers on the harm we do to our bodies with an extra cigarette, sausage, pint of beer or glass of wine, or the lack of five-a-day fruit and veg, or – on the virtuous side – the benefits
we might reap on the exercise bike or by being otherwise wholesome and pure.
But we can calculate the effects approximately, by averaging over many lifetimes, and it is worth trying, especially in a world of exhortations to self-improvement or stories of how you too can stay forever beautiful and young – or not.
There is one big difference between MicroMorts and MicroLives. If you survive your motor-bike ride, your MicroMort slate is wiped clean and you start the next day with an empty account. But if you smoke all day and live on pork pies, then your used-up MicroLives accumulate. It’s like a lottery where the tickets you buy each day remain valid for ever – and so your chances of winning increase. Except that in this case you really don’t want to.