Thinking, Fast and Slow (18 page)
Read Thinking, Fast and Slow Online
Authors: Daniel Kahneman

Linda was not the only conjunction error that survived joint evaluation. We found similar violations of logic in many other judgments. Participants in one of these studies were asked to rank four possible outcomes of the next Wimbledon tournament from most to least probable. Björn Borg was the dominant tennis player of the day when the study was conducted. These were the outcomes:
A. Borg will win the match.
B. Borg will lose the first set.
C. Borg will lose the first set but win the match.
D. Borg will win the first set but lose the match.
The critical items are B and C. B is the more inclusive event and its probability
must
be higher than that of an event it includes. Contrary to logic, but not to representativeness or plausibility, 72% assigned B a lower probability than C—another instance of less is more in a direct comparison. Here si again, the scenario that was judged more probable was unquestionably more plausible, a more coherent fit with all that was known about the best tennis player in the world.
To head off the possible objection that the conjunction fallacy is due to a misinterpretation of probability, we constructed a problem that required probability judgments, but in which the events were not described in words, and the term
probability
did not appear at all. We told participants about a regular six-sided die with four green faces and two red faces, which would be rolled 20 times. They were shown three sequences of greens (G) and reds (R), and were asked to choose one. They would (hypothetically) win $25 if their chosen sequence showed up. The sequences were:
- RGRRR
- GRGRRR
- GRRRRR
Because the die has twice as many green as red faces, the first sequence is quite unrepresentative—like Linda being a bank teller. The second sequence, which contains six tosses, is a better fit to what we would expect from this die, because it includes two G’s. However, this sequence was constructed by adding a G to the beginning of the first sequence, so it can only be less likely than the first. This is the nonverbal equivalent to Linda being a feminist bank teller. As in the Linda study, representativeness dominated. Almost two-thirds of respondents preferred to bet on sequence 2 rather than on sequence 1. When presented with arguments for the two choices, however, a large majority found the correct argument (favoring sequence 1) more convincing.
The next problem was a breakthrough, because we finally found a condition in which the incidence of the conjunction fallacy was much reduced. Two groups of subjects saw slightly different variants of the same problem:
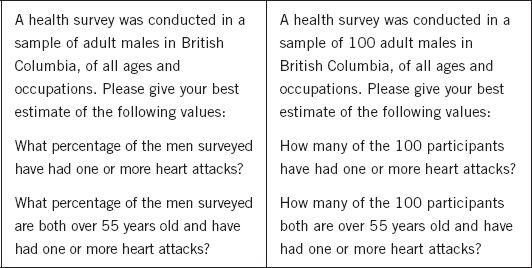
The incidence of errors was 65% in the group that saw the problem on the left, and only 25% in the group that saw the problem on the right.
Why is the question “How many of the 100 participants…” so much easier than “What percentage…”? A likely explanation is that the reference to 100 individuals brings a spatial representation to mind. Imagine that a large number of people are instructed to sort themselves into groups in a room: “Those whose names begin with the letters
A
to
L
are told to gather in the front left corner.” They are then instructed to sort themselves further. The relation of inclusion is now obvious, and you can see that individuals whose name begins with
C
will be a subset of the crowd in the front left corner. In the medical survey question, heart attack victims end up in a corner of the room, and some of them are less than 55 years old. Not everyone will share this particular vivid imagery, but many subsequent experiments have shown that the frequency representation, as it is known, makes it easy to appreciate that one group is wholly included in the other. The solution to the puzzle appears to be that a question phrased as “how many?” makes you think of individuals, but the same question phrased as “what percentage?” does not.
What have we learned from these studies about the workings of System 2? One conclusion, which is not new, is that System 2 is not impressively alert. The undergraduates and graduate students who participated in our thastudies of the conjunction fallacy certainly “knew” the logic of Venn diagrams, but they did not apply it reliably even when all the relevant information was laid out in front of them. The absurdity of the less-is-more pattern was obvious in Hsee’s dinnerware study and was easily recognized in the “how many?” representation, but it was not apparent to the thousands of people who have committed the conjunction fallacy in the original Linda problem and in others like it. In all these cases, the conjunction appeared plausible, and that sufficed for an endorsement of System 2.
The laziness of System 2 is part of the story. If their next vacation had depended on it, and if they had been given indefinite time and told to follow logic and not to answer until they were sure of their answer, I believe that most of our subjects would have avoided the conjunction fallacy. However, their vacation did not depend on a correct answer; they spent very little time on it, and were content to answer as if they had only been “asked for their opinion.” The laziness of System 2 is an important fact of life, and the observation that representativeness can block the application of an obvious logical rule is also of some interest.
The remarkable aspect of the Linda story is the contrast to the broken-dishes study. The two problems have the same structure, but yield different results. People who see the dinnerware set that includes broken dishes put a very low price on it; their behavior reflects a rule of intuition. Others who see both sets at once apply the logical rule that more dishes can only add value. Intuition governs judgments in the between-subjects condition; logic rules in joint evaluation. In the Linda problem, in contrast, intuition often overcame logic even in joint evaluation, although we identified some conditions in which logic prevails.
Amos and I believed that the blatant violations of the logic of probability that we had observed in transparent problems were interesting and worth reporting to our colleagues. We also believed that the results strengthened our argument about the power of judgment heuristics, and that they would persuade doubters. And in this we were quite wrong. Instead, the Linda problem became a case study in the norms of controversy.
The Linda problem attracted a great deal of attention, but it also became a magnet for critics of our approach to judgment. As we had already done, researchers found combinations of instructions and hints that reduced the incidence of the fallacy; some argued that, in the context of the Linda problem, it is reasonable for subjects to understand the word “probability” as if it means “plausibility.” These arguments were sometimes extended to suggest that our entire enterprise was misguided: if one salient cognitive illusion could be weakened or explained away, others could be as well. This reasoning neglects the unique feature of the conjunction fallacy as a case of conflict between intuition and logic. The evidence that we had built up for heuristics from between-subjects experiment (including studies of Linda) was not challenged—it was simply not addressed, and its salience was diminished by the exclusive focus on the conjunction fallacy. The net effect of the Linda problem was an increase in the visibility of our work to the general public, and a small dent in the credibility of our approach among scholars in the field. This was not at all what we had expected.
If you visit a courtroom you will observe that lawyers apply two styles of criticism: to demolish a case they raise doubts about the strongest arguments that favor it; to discredit a witness, they focus on the weakest part of the testimony. The focus on weaknesses is also normal in politicaverl debates. I do not believe it is appropriate in scientific controversies, but I have come to accept as a fact of life that the norms of debate in the social sciences do not prohibit the political style of argument, especially when large issues are at stake—and the prevalence of bias in human judgment is a large issue.
Some years ago I had a friendly conversation with Ralph Hertwig, a persistent critic of the Linda problem, with whom I had collaborated in a vain attempt to settle our differences. I asked him why he and others had chosen to focus exclusively on the conjunction fallacy, rather than on other findings that provided stronger support for our position. He smiled as he answered, “It was more interesting,” adding that the Li
nda problem had attracted so much attention that we had no reason to complain.
Speaking of Less is More
“They constructed a very complicated scenario and insisted on calling it highly probable. It is not—it is only a plausible story.”
“They added a cheap gift to the expensive product, and made the whole deal less attractive. Less is more in this case.”
“In most situations, a direct comparison makes people more careful and more logical. But not always. Sometimes intuition beats logic even when the correct answer stares you in the face.”
Consider the following scenario and note your intuitive answer to the question.
A cab was involved in a hit-and-run accident at night.
Two cab companies, the Green and the Blue, operate in the city.
You are given the following data:
- 85% of the cabs in the city are Green and 15% are Blue.
- A witness identified the cab as Blue. The court tested the reliability of the witness under the circumstances that existed on the night of the accident and concluded that the witness correctly identified each one of the two colors 80% of the time and failed 20% of the time.
What is the probability that the cab involved in the accident was Blue rather than Green?
This is a standard problem of Bayesian inference. There are two items of information: a base rate and the imperfectly reliable testimony of a witness. In the absence of a witness, the probability of the guilty cab being Blue is 15%, which is the base rate of that outcome. If the two cab companies had been equally large, the base rate would be uninformative and you would consider only the reliability of the witness,%"> our w
Causal Stereotypes
Now consider a variation of the same story, in which only the presentation of the base rate has been altered.
You are given the following data:
- The two companies operate the same number of cabs, but Green cabs are involved in 85% of accidents.
- The information about the witness is as in the previous version.
The two versions of the problem are mathematically indistinguishable, but they are psychologically quite different. People who read the first version do not know how to use the base rate and often ignore it. In contrast, people who see the second version give considerable weight to the base rate, and their average judgment is not too far from the Bayesian solution. Why?
In the first version, the base rate of Blue cabs is a statistical fact about the cabs in the city. A mind that is hungry for causal stories finds nothing to chew on: How does the number of Green and Blue cabs in the city cause this cab driver to hit and run?
In the second version, in contrast, the drivers of Green cabs cause more than 5 times as many accidents as the Blue cabs do. The conclusion is immediate: the Green drivers must be a collection of reckless madmen! You have now formed a stereotype of Green recklessness, which you apply to unknown individual drivers in the company. The stereotype is easily fitted into a causal story, because recklessness is a causally relevant fact about individual cabdrivers. In this version, there are two causal stories that need to be combined or reconciled. The first is the hit and run, which naturally evokes the idea that a reckless Green driver was responsible. The second is the witness’s testimony, which strongly suggests the cab was Blue. The inferences from the two stories about the color of the car are contradictory and approximately cancel each other. The chances for the two colors are about equal (the Bayesian estimate is 41%, reflecting the fact that the base rate of Green cabs is a little more extreme than the reliability of the witness who reported a Blue cab).
The cab example illustrates two types of base rates.
Statistical base rates
are facts about a population to which a case belongs, but they are not relevant to the individual case.
Causal base rates
change your view of how the individual case came to be. The two types of base-rate information are treated differently: