Time Warped (13 page)
Authors: Claudia Hammond

We’ve become very attached to using decades as units for organising time. Yet according to the historian Dominic Sandbrook, in Britain, for example, in earlier centuries decades were barely mentioned as time was divided by the reigns of different monarchs. Of course, both the reign of Richard II and the decade of the 1920s are arbitrary units of time. And the further into the past they recede, the less utility they possess for helping us to organise time in our minds. I’d bet that for you Richard II (1367 to 1400) has been swallowed up into ‘the Middle Ages’. In the same way, the 1920s will for people of future centuries be lumped
together into a general representation of the twentieth century. Just think: these people in their space suits will be no more likely to differentiate between an Edwardian gentleman and a Teddy Boy than we do between styles of armour in the 1310s and the 1350s. And they may well be confronting their own millennium problem – where to put the year 3000!
COLOURING-IN HISTORY
You’ll recall that, for me, Monday is red. For some people whole decades or centuries have their own colours and it needn’t be a solid block of a single colour. One person wrote to tell me that the even years are in the light and the odd numbers in shadow. For many, gaps in historical knowledge are often just left dark, and when there is colour or light it doesn’t necessarily correspond with the prevailing mood of that time in history. For one listener the First World War took place in a decade bathed in sunshine. For others the 1940s are purple and the Elizabethan period is midnight blue. I particularly like this description from Katherine Herepath, who tells me she loves history:
‘I see the last two millennia as laid out in columns, like a reverse ledger sheet. It’s as if I am standing at the top of the twenty-first century looking downwards to 2000. Future centuries float as a gauzy sheet stretching over to the left. I also see people, architecture and events laid out chronologically in the columns. When I think of the year 1805, I see Trafalgar, women
in the clothes of that era, famous people who lived then, the buildings, etc. The sixth to tenth centuries are very green, the Middle Ages are dark with vibrant splashes of red and blue and the sixteenth and seventeenth centuries are brown with rich, lush colours in the furniture and clothing.’
These are not just pretty pictures; they are useful too. They allow people to hold knowledge in mind and put some kind of order onto the thousands of historical facts they’ve picked up. The memory champion Ed Cooke employs visual imagery of time deliberately. He suggests that to remember everything in your diary you imagine each day as a different object. If Monday is a car, then each hour of the day is represented by a different part of the car. Then you mentally place your appointments in the appropriate section of the vehicle. So you might picture your dentist perched on top of the steering wheel to symbolise your 10 a.m. appointment, while a tiny version of your boss is trapped inside the headlight for your 2 p.m. meeting. He is employing visualisation as a deliberate strategy, but it involves creating the basic scaffolding for the appointments to hang off. Those with time/space synaesthesia have a distinct advantage. The scaffold is already there. There is a ready-made picture in mind for them to use should they choose to enhance their memory for events in time. One participant in my study told me her pictorial view of the past had been essential for memorising dates for her history and law degrees. But the ability to visualise time in space is not just useful for making sense of history.
Some people sent me accounts of using spatial visualisation of time to plan ahead. Others used the vividness of the mental pictures to help with memory feats that have no association with time; one had such a clear view of the months of the year forming a circle that in her mind’s eye she placed physics formulae in the middle and was then able to remember them.
The comedian Chella Quint uses what she refers to as her ‘slinky of time’ for booking gigs, named after the toy invented in the 1940s by Richard James, a naval engineer working on a horsepower meter for battleships. When a spring fell off the table and onto the ground he noticed that it seemed to have a life of its own. His wife came up with the name and the Slinky was born. Decades later, this is how Chella Quint pictures time:
‘I see time as a spiral going infinitely out ahead of me and slightly upward into the future, and infinitely down behind me at an angle for the past (my own past and world history as well). The year is basically a circle, with the spiral to the next level at the New Year. I can use my slinky calendar to remember events by compressing the slinky. If I was trying to remember one winter vacation, I can look at all the Decembers in a column (because when I compress the slinky of time, all the months line up at the same point in the circle) till I find the one I want. I have no control over seeing the compressed coil shape and I’m not choosing to do it – I just do.’
Many people insist that these images give them an advantage when it comes to quick-thinking and new experimental evidence seems to back up this contention. In Vancouver psychologist Heather Mann gave people a tricky task – one you can try for yourself.
Recite the months of the year out loud going backwards in threes, starting from November.
It’s not easy, but some if you will find it easier than others. The better performers in Mann’s test were the people who had a ‘map’ of the year in their mind displaying all the months in a clear visual format. This made for much quicker calculation.
40
You might be thinking that proficiency in this particular exercise is not a terribly useful skill and you’d be right. But in everyday life we are constantly required to manipulate time-based information, such as working out exactly how many days there are before a deadline or how much leave we have left, and this is where the time/spacers might have an advantage.
THE SNARC EFFECT
One of the most widely used tests in psychological research involves flashing a up a stream of words one at a time on a computer screen, written in different coloured fonts. The respondent has an apparently simple task: to hit as quickly as possible a key on a computer keyboard which the test setter has designated as corresponding to the colour of the word. So, say, d for red and p for blue. Easy – and not
very interesting to psychologists surely? But this exercise is surprisingly powerful. Say the word flashed up on the screen is ‘doughnut’. Respondents are told at the beginning of the test that the meaning of the word is irrelevant. The only thing that matters is the colour of the word on the screen. So, the respondent just has to hit d on their keyboard if the word doughnut is red and p if it is blue. It turns out that a person suffering from anorexia is significantly slower than the average in doing this simple exercise. Why? Because their anxiety at the thought of a ‘doughnut’ gets in the way of the task in front of them and slows down their ability to complete it. When the word is ‘room’ they can do it just as fast as anyone else. This kind of test has demonstrated over many years the way the speed of the response to something flashing up on a computer screen can be used to tap in to the way a person thinks, without a person being able to cheat on the test.
So what can a variation on this test tell us about the spatial visualisation of time? At the University of Bergen in Norway, Mark Price asks time/space synaesthetes to draw a diagram of how they see the layout of the months of the year. He then sits them at a computer that flashes up the months randomly on the screen. This time there are no coloured words. All the respondents are asked to do is press one designated key for months early in the year and another key for those later in the year. What Price has found is this: if a person’s mental map of the year has, say, March up in the left-hand corner then they are quicker at hitting the
designated key for an early month if that key is on the left of the keyboard. The same person will be slower if the designated key for an early month is N – a key in bottom right-hand corner of a keyboard. The mental map is never referred to and in theory people should respond at the same speed, whatever the location of the computer key. But they cannot help but picture the mental map, making time faster when the key they have to press happens to fit in with their personal map.
41
This finding has the rather nice name of the SNARC effect – nothing to do with poetic monsters, but an acronym for Spatial Numerical Association of Response Codes. I had a go myself in the experimental psychology lab at Sussex University run by Jamie Ward. The results were striking. Although the difference in my reaction times was only a matter of milliseconds, the pattern over hundreds of attempts was clear. Every time the designated key on the keyboard for the early months was on the left (for me the ‘correct’ place on my mental diagram of the year so where I would expect to find January, February, etc.) my reaction time was faster. You might say, ‘Well, you knew what you were being tested for.’ True. But, even with me, the test was cheat-proof. It all happened so fast there was no way that, even if I’d wanted to, I could have factored out my mind map of the months.
DO WE ALL SEE TIME IN SPACE
?
We have heard earlier in this chapter that people are sometimes shy of discussing their ability to see time in space. I hope those reading this book will decide that they should now come out loud and proud as time/space synaesthetes.
It’s a useful skill to possess, but only if you allow yourself to use it to its full potential. Why struggle to picture the months in line with an Outlook planner or Filofax diary if you see them in a circle or a three-dimensional spiral? If you work with your brain, rather than against it, aren’t you more likely to remember important dates like your mother-in-law’s birthday or when to file your tax return? So let it happen. Draw your own time map onto a whiteboard or into a diary and you can improve your memory for time-related events.
Now you might think that this piece of advice only applies to the 20 per cent of people who picture time automatically. However, there is evidence to suggest that we can all use space to code time to some extent. This is not a new idea. In fact the notion is centuries old – John Locke discussed it as early as 1689 and William James described dates as having positions in space back in the nineteenth century. Maybe they were both space/timers. At Ghent University, Wim Gevers found that when a study required people to draw a plan of how they visualised the months of the year, even those to whom it did not come naturally were able to draw something.
42
So I think the ability to picture time is a continuum: at one end are the people who instantly see ladders and slinkys and at the other are the people who have never wondered how they picture the year until pressed to do so.
Here’s something else to try.
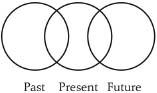
Draw three circles on a piece of paper representing the past, the present and the future. You can put the circles anywhere on the page, touching or not, and they can be of different sizes if you want them to. There are no right or wrong answers.
While you are doing it, I will tell you about the person who invented this test: Thomas Cottle. He conducted his investigations into time perception in the 1970s using US Navy personnel, who were all accustomed to following instructions.
43
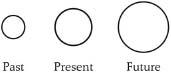
They were told to do the exercise, and so they did. Cottle found that 60 per cent of his respondents drew three separate circles, with the future represented by the largest circle, and the past by the smallest. Most didn’t make the circles overlap, leading Cottle to conclude that people (or US sailors anyway) tend to see the past, present and future as discrete time periods.
Cottle was not terribly happy with these results. He thought, rather unfairly in my view, that this atomistic view of time was rather childlike. In his opinion it would be logical for the circles to overlap like in a Venn diagram to suggest the connectedness of time and the impact the past has on the present and the present on the future.