Authors: Mehmed Kantardzic
Data Mining (130 page)

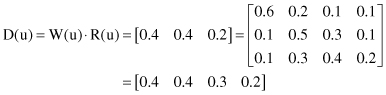
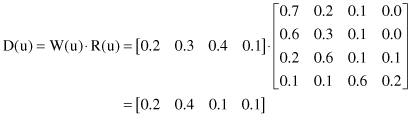
then it is possible to apply the multifactorial-evaluation model to compute the evaluation for a piece of cloth u. “Multiplication” of matrices W(u) and R(u) is based on the max–min composition of fuzzy relations, where the resulting evaluation is in the form of a fuzzy set D(u) = [d
1
, d
2
, d
3
, d
4
]:
where, for example, d
1
is calculated through the following steps:
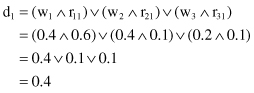
The values for d
2
, d
3
, and d
4
are found similarly, where ∧ and ∨ represent the operations min and max, respectively. Because the largest components of D(u) are d
1
= 0.4 and d
2
= 0.4 at the same time, the analyzed piece of cloth receives a rating somewhere between “best” and “good.”
14.5.2 A Problem of Evaluating Teaching
Assume that the basic factors that influence students’ evaluation of teaching are f
1
= clarity and understandability, f
2
= proficiency in teaching, f
3
= liveliness and stimulation, and f
4
= writing neatness or clarity, that is, F = {f
1
, f
2
, f
3
, f
4
}. Let E = {e
1
, e
2
, e
3
, e
4
} = {excellent, very good, good, poor} be the verbal grade set. We evaluate a teacher u. By selecting an appropriate group of students and faculty, we can have them respond with their ratings on each factor and then obtain the single-factor evaluation. As in the previous example, we can combine the single-factor evaluation into an evaluation matrix. Suppose that the final matrix R(u) is
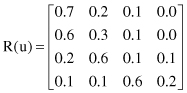
For a specific weight vector W(u) = {0.2, 0.3, 0.4, 0.1}, describing the importance of the teaching-evaluation factor f
i
and using the multifactorial-evaluation model, it is easy to find
Analyzing the evaluation results D(u), because d
2
= 0.4 is a maximum, we may conclude that teacher u should be rated as “very good.”
14.6 EXTRACTING FUZZY MODELS FROM DATA
In the context of different data-mining analyses, it is of great interest to see how fuzzy models can automatically be derived from a data set. Besides prediction, classification, and all other data-mining tasks, understandability is of prime concern, because the resulting fuzzy model should offer an insight into the underlying system. To achieve this goal, different approaches exist. Let us explain a common technique that constructs grid-based rule sets using a global granulation of the input and output spaces.
Grid-based rule sets
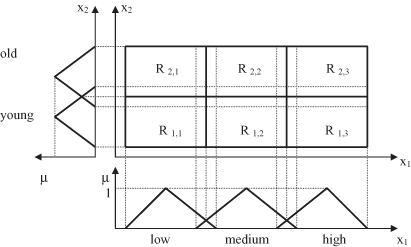
model each input variable usually through a small set of linguistic values. The resulting rule base uses all or a subset of all possible combinations of these linguistic values for each variable resulting in a global granulation of the feature space into rectangular regions. Figure
14.14
illustrates this approach in two dimensions: with three linguistic values (low, medium, high) for the first dimension x
1
and two linguistic values for the second dimension x
2
(young, old).
Figure 14.14.
A global granulation for a two-dimensional space using three membership functions for x
1
and two for x
2
.
Extracting grid-based fuzzy models from data is straightforward when the input granulation is fixed, that is, the antecedents of all rules are predefined. Then, only a matching consequent for each rule needs to be found. This approach, with fixed grids, is usually called the
Mamdani model
. After predefinition of the granulation of all input variables and also the output variable, one sweeps through the entire data set and determines the closest example to the geometrical center of each rule, assigning the closest fuzzy value output to the corresponding rule. Using graphical interpretation in a 2-D space, the global steps of the procedure are illustrated through an example in which only one input x and one output dimension y exist. The formal analytical specification, even with more than one input/output dimension, is very easy to establish.
1.
Granulate the Input and Output Space.
Divide each variable x
i
into n
i
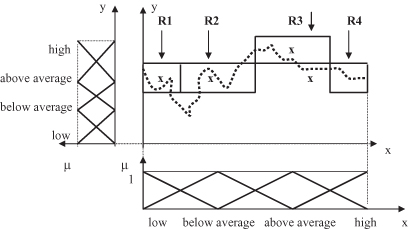
equidistant, triangular, MFs. In our example, both input x and output y are granulated using the same four linguistic values: low, below average, above average, and high. A representation of the input–output granulated space is given in Figure
14.15
.
2.
Analyze the Entire Data Set in the Granulated Space.
First, enter a data set in the granulated space and then find the points that lie closest to the centers of the granulated regions. Mark these points and the centers of the region. In our example, after entering all discrete data, the selected center points (closest to the data) are additionally marked with x
,
as in Figure
14.16
.
3.
Generate Fuzzy Rules from Given Data.
Data representative directly selects the regions in a granulated space. These regions may be described with the corresponding fuzzy rules. In our example, four regions are selected, one for each fuzzy input linguistic value, and they are represented in Figure
14.17
with a corresponding crisp approximation (a thick line through the middle of the regions). These regions are the graphical representation of fuzzy rules. The same rules may be expressed linguistically as a set of IF-THEN constructions:
| R 1 : | IF x is small , THEN y is above average . |
| R 2 : | IF x is below average , THEN y is above average . |
| R 3 : | IF x is above average , THEN y is high . |
| R 4 : | IF x is high, THEN y is above average. |
Figure 14.15.
Granulation of a two-dimensional I/O space.
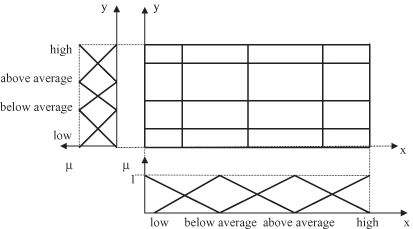
Figure 14.16.
Selection of characteristic points in a granulated space.
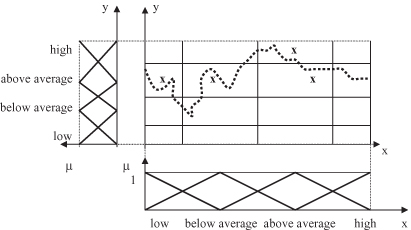
Figure 14.17.
Graphical representation of generated fuzzy rules and the resulting crisp approximation.