Read iOS Programming: The Big Nerd Ranch Guide, 3/e (Big Nerd Ranch Guides) Online
Authors: Aaron Hillegass,Joe Conway
Tags: #COM051370, #Big Nerd Ranch Guides, #iPhone / iPad Programming
iOS Programming: The Big Nerd Ranch Guide, 3/e (Big Nerd Ranch Guides) (72 page)

Another useful instrument is
Leaks
. Although this instrument is less useful now that ARC handles memory management, we know that there is still a possibility of leaking memory with a retain cycle.
Leaks
can help us find retain cycles.
First, we need to introduce a retain cycle into our application. Let’s pretend that every
Line
needs to know what array of lines it belongs to. Add a new property to
Line.h
.
Synthesize this property in
Line.m
.
@synthesize begin, end;
@synthesize containingArray;
@end
In
TouchDrawView.m
, set every completed line’s
containingArray
property in
endTouches:
.
{
for (UITouch *t in touches) {
NSValue *key = [NSValue valueWithNonretainedObject:t];
Line *line = [linesInProcess objectForKey:key];
if (line) {
[completeLines addObject:line];
[linesInProcess removeObjectForKey:key];
[line setContainingArray:completeLines];
}
}
[self setNeedsDisplay];
}
Finally, in
clearAll
of
TouchDrawView.m
, comment out the code that removes all of the objects from the
completeLines
and create a new instance of
NSMutableArray
instead.
{
[linesInProcess removeAllObjects];
// [completeLines removeAllObjects];
completeLines = [[NSMutableArray alloc] init];
[self setNeedsDisplay];
}
Build and profile the application. Choose
Leaks
as the instrument to use.
Draw a few lines and then double tap the screen to clear it. Select the
Leaks
instrument from the top left table and wait a few seconds. Three items will appear in the summary table: an
NSMutableArray
, a few
Line
instances, and a
Malloc 16 Bytes
block. This memory has been leaked.
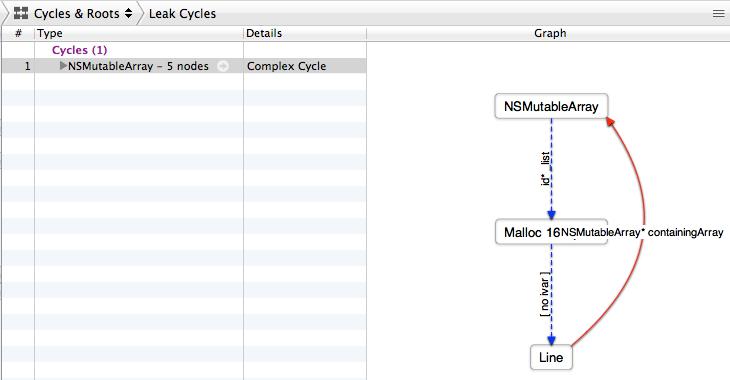
Select the
Leaks
pop-up button in the breadcrumb bar and change it to
Cycles & Roots
(
Figure 21.19
). This view gives you a lovely graphical representation of the retain cycle: an
NSMutableArray
(our
completeLines
array) has a reference to a list of
Line
s, and each
Line
has a reference back to its
containingArray
.
Figure 21.19 Cycles and Roots
You can of course fix this problem by making the
containingArray
property a weak reference. Or just remove the property and undo your changes to
endTouches:
and
clearAll
.
This should give you a good start with the
Instruments
application. The more you play with it, the more adept at using it you will become. One final word of warning before you invest a significant amount of your development time using
Instruments
: If there is no performance problem, don’t fret over every little row in
Instruments
. It is a tool for diagnosing existing problems, not for finding new ones. Write clean code that works first; then, if there is a problem, you can find and fix it with the help of
Instruments
.
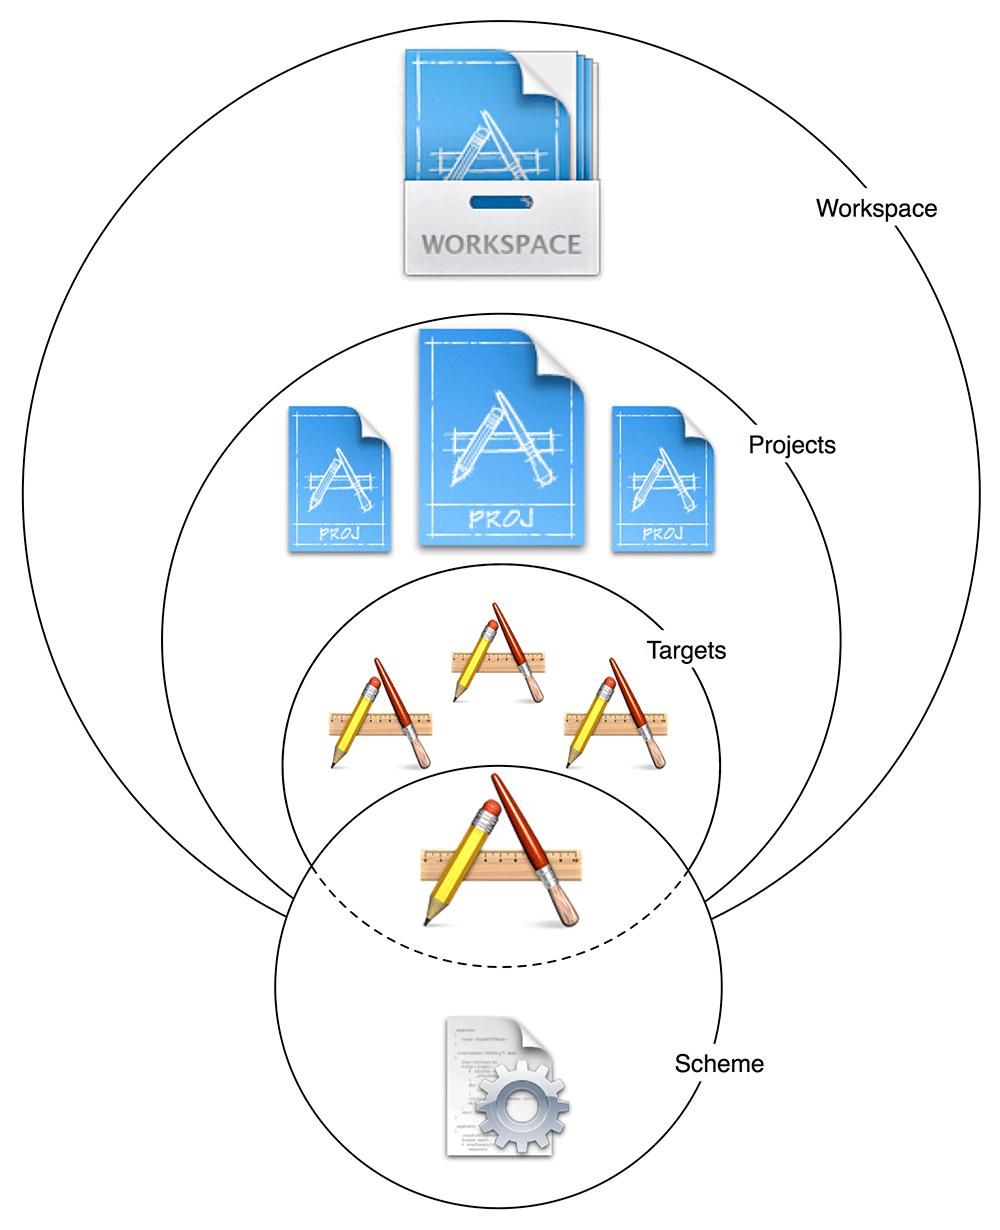
In
Xcode
, a workspace is a collection of projects, and a project is a collection targets and files. A target has a number of build settings and phases that reference files from its project. When built, a target creates a product, which is usually an application.
A
scheme
contains one or more targets
and
specifies what to do with the product or products (
Figure 21.20
).
Figure 21.20 Xcode containers
When you create a new project, a scheme with the same name as the project is created for you. For instance, the
TouchTracker
project has a
TouchTracker
scheme, and this scheme contains the
TouchTracker
target, which is responsible for building the
TouchTracker
iOS application.
To view the details of a scheme, click the
Scheme
pop-up menu at the top left of the
Xcode
window and select
Edit Scheme...
. The
scheme editor
will drop down into the workspace (
Figure 21.21
).
Figure 21.21 Editing a scheme
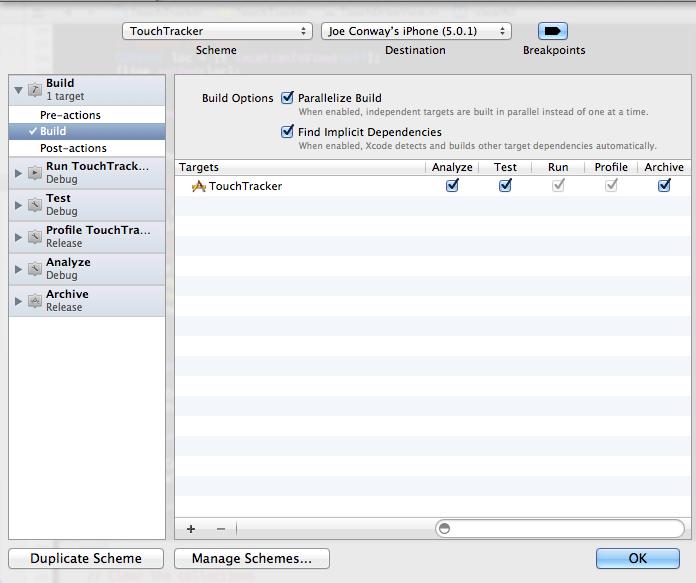
On the left side of the scheme editor is the list of actions that every scheme can do. (Notice that these scheme actions are also the choices you see when you click and hold the
Run
button in the
Xcode
workspace with the exception of
Archive
.) Selecting a scheme action here shows its options in the details pane. Take a moment to look over the actions and the available options. Notice that some actions have multiple tabs that categorize their options.
As projects become larger and more complicated, they require more specific testing and debugging. To avoid having to constantly edit one scheme, we typically create new schemes for common situations. For example, if we have an application that consumes a lot of memory, we might want to routinely run the
Allocations
instrument on it. Instead of having
Instruments
ask which instrument to use when we profile the application, we can set up a new scheme that always runs
Allocations
.
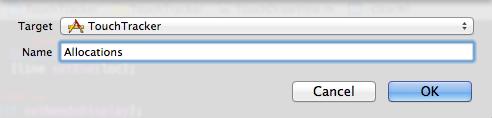
Let’s set up this scheme for the
TouchTracker
target. From the
Scheme
pop-up menu, select
New Scheme...
. When the sheet drops down, enter
Allocations
into the name and make sure
TouchTracker
is selected as the target (
Figure 21.22
). Click
OK
.
Figure 21.22 Creating a new scheme
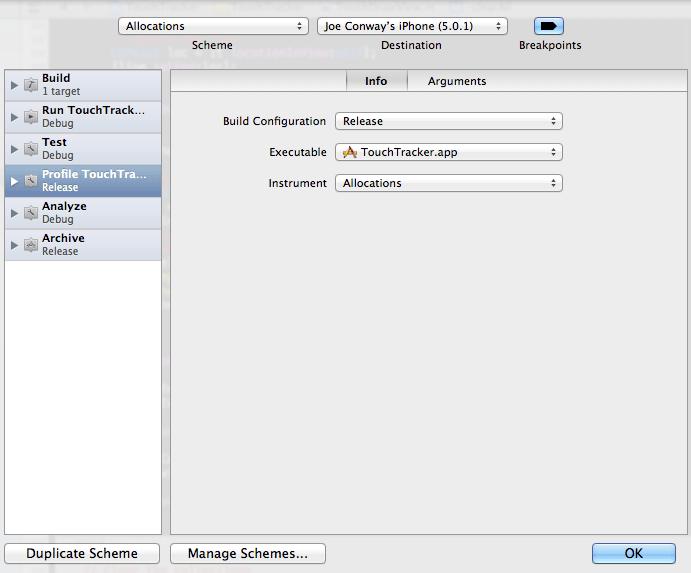
Reopen the scheme editor sheet either by selecting
Edit Scheme...
from the
Scheme
pop-up menu or using the keyboard shortcut Command-Shift-<. Then click the
Scheme
pop-up menu in the scheme editor and select
Allocations
. Select the
Profile
action from the left table. On the detail pane, change the
Instrument
pop-up to
Allocations
and click
OK
(
Figure 21.23
).
Figure 21.23 An allocations-only scheme
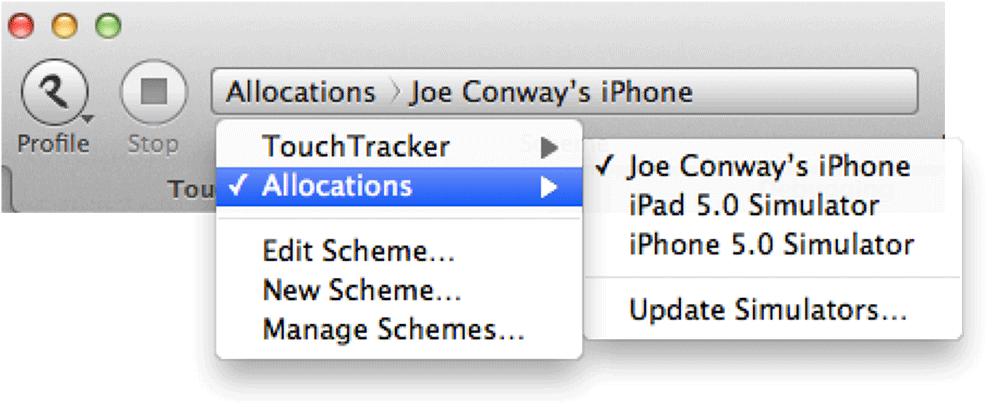
To use your new scheme, click the
Scheme
pop-up menu back on the workspace window. Here you can choose which scheme to use and a destination device for that scheme. Choose one of the destination options under the
Allocations
heading (
Figure 21.24
). Then, profile your application.
Instruments
will launch your application and automatically start the
Allocations
instrument.
Figure 21.24 Choosing a scheme
Switch back to the default
TouchTracker
scheme and profile again. This time,
Instruments
will again ask you to choose an instrument.
Here’s a handy scheme tip: hold down the Option key when selecting a scheme action from the
Run
button. This automatically opens the scheme editor and allows you to quickly review and change the settings of the selected scheme before performing the action. In fact, holding down the Option key will open the scheme editor whether you select the action from the
Run
pop-up button, from the
Product
menu, or use a keyboard shortcut.