More Guns Less Crime (27 page)
Read More Guns Less Crime Online
Authors: John R. Lott Jr
Tags: #gun control; second amendment; guns; crime; violence

Sharon Stone, the movie actress, made headlines by publicly announcing her decision to give up her guns "even though she once saved her life by pointing a loaded shotgun at a crazed stalker" after three telephone calls to 911 failed to get the police to arrive. She decided that with all the recent violence and accidents involving guns she was afraid of having guns in her home. 1 Another reaction is the suspension from school of sixth-graders for accidentally having a squirt gun in their backpacks. 2
President Clinton puts forward a program to spend $15 million to buy guns from people living in cities. Andrew Cuomo, the secretary of housing and urban development, warns that "reducing guns reduces crime. We know that. Reducing guns also reduces the number of accidents that occur.... It reduces the number of suicides through guns." 3
Newsweek recently devoted a special issue to guns and violence. 4 Despite thirty-four pages on the topic, the notion of defensive gun use was not mentioned even once. ABC's Nightline has had guests advising people not to use firearms for self-defense and instead suggesting, "We would recommend and possibly assist with a review of the security of the building and if necessary recommend further security to attend the house if they require it." 5 Yet we are not indoors all the time, and even being inside does not guarantee protection.
With all the news coverage of only the bad things that happen with guns and the constant drumbeat of claims from the Clinton administration, I can understand the public's reaction to guns. 6
The news is also filled with brutal crimes against women, but none of the mainstream media mention the possibility of women getting guns to defend themselves. The assumption that the police will always be avail-
able to protect us collides directly with the horrible event that is being covered on the news. What should people do when the police are not able to be there? By contrast, when bad events happen with guns the question that is normally asked is: Are more gun controls needed? No one asks: Did banning guns from certain areas make the law-abiding citizens more vulnerable?
The following sections will examine new data on concealed-handgun laws and ask whether many of the new proposed reforms ranging from safe-storage laws to one-gun-a-month rules will save lives. I then respond to the criticisms made after my book was published.
Updating the Basic Results
I started this research several years ago with data from 1977 to 1992, all the county data that were available at that time. When the book was first published, I had updated the data through 1994. It is now possible to expand the data even further, through 1996. This is quite important, since so many states very recently have passed right-to-carry laws. During 1994, Alaska, Arizona, Tennessee, and Wyoming enacted new right-to-carry laws, and during 1995, Arkansas, Nevada, North Carolina, Oklahoma, Texas, and Utah followed suit. 7 Between 1977 and 1996 a total of twenty states had changed their laws and had them in effect for at least one full year. 8
Some commentators complained that even though my study was by far the largest statistical crime study ever, there was simply not enough data to properly evaluate the impact of the laws. Others suspected that the findings were simply a result of studying relatively unusual states. 9 Another criticism was that poverty was not properly accounted for. 10
While the methods I used in the book were by far the most comprehensive that I know of, I have continued to look into other methods. By putting together an entirely new data set—using city-level information—it is possible to go beyond my previous efforts to control for policing-policy variables such as arrest and conviction rates, number of police per-capita, expenditures on police per capita, and a proxy for the so-called broken-windows policing policy. The city-level data that I have now compiled include direct information on whether a city has adopted community policing, problem-oriented policing, and/or the broken-windows approach.
One of the commentators on my book suggested that in addition to year-to-year changes in the national crime rate as well as state and county crime trends, another way to account for crime cycles is by measuring whether the crime rates are falling faster in right-to-carry states
than in other states in their region rather than compared to just the nation as a whole. While it is impossible to use a separate variable for each year for each individual state, because that would falsely appear to explain all the year-to-year changes in average crime rates in a state, it is possible to group states together. This new set of estimates would account not only for whether the crime rates in concealed-handgun states are falling relative to the national crime rate but now also for whether they are falling relative to the crime rates in their region. To do this, the country is divided into five regions (Northeast, South, Midwest, Rocky Mountains, and Pacific) and variables are added to measure the year-to-year changes in crime by region. n All county- and city-level regressions will employ these additional control variables.
Some have criticized my earlier work for not doing enough to account for poverty rates. As a response, I have incorporated in this section of the book state-level measures of poverty and unemployment rates in addition to all the county-level variables that accounted for these factors earlier in this book. The execution rates for murders in each state are now included in estimates to explain the murder rate. Finally, new data on the number of permits granted in different states make it easier to link crime rates to the number of permits granted.
Reviewing the Basic Results
The central question is, How did crime rates change before and after the right-to-carry laws went into effect? The test used earlier in this book examined the difference in the time trends before and after the laws were enacted. 12 With the extended data and the additional variables for the year-to-year changes in crime by region (so-called regional fixed year effects), state poverty, unemployment, and death-penalty execution rates, table 9.1 shows that this pattern closely resembles the pattern found earlier in the book: violent-crime rates were rising consistently before the right-to-carry laws and falling thereafter. 13 The change in these before-and-after trends was always extremely significant—at least at the 0.1 percent level. Compared to the results for tables 4.8 or 4.13, the effects were larger for overall violent crimes, rape, robbery, and aggravated assaults and smaller for murder. For each additional year that the laws were in effect, murders fell by an additional 1.5 percent, while rape, robbery, and aggravated assaults all fell by about by 3 percent each year. The other variables continued to produce results similar to those that were found earlier. 14
While no previous crime study accounts for year-to-year changes in regional crime rates, it is possible to go even beyond that and combine
Table 9.1 Reexamining the change in time trends before and after the adoption of nondiscretionary laws, using additional data for 1995 and 1996
Percent change in various crime rates for changes in explanatory variables
Violent Aggravated Property
crime Murder Rape Robbery assault crime
Burglary Larceny
Auto theft
Change in the crime rate from the difference in the annual change in crime rates in the years before and after the adoption of the right-to-carry law (annual rate of change after the law — annual rate of change before the law)
-13%*
-1.5%*
-3.2%*
-1.9%*
-3.0%*
-1.6%*
-2.5%*
-0.9%*
-2.1%*
Note: This table uses county-level violent and property-crime data from the Uniform Crime Report that were not available when I originally wrote the book. All regressions use weighted least squares, where the weighting is each county's population. The regressions correspond to those in tables 4.8 and 4.13. The one difference from the earlier estimates is that these regressions now also allow the regional fixed effects to vary by year.
different approaches. Including not only the factors accounted for in table 9.1 but also individual state time trends produces similar results. The annual declines in crime from right-to-carry laws are greater for murder (2.2 percent), rape (3.9 percent), and robbery rates (4.9 percent), while the impact on aggravated assaults (0.8 percent) and the property crime rates (0.9 percent) is smaller.
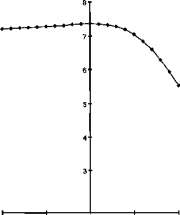
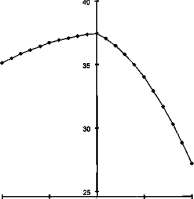
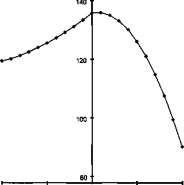
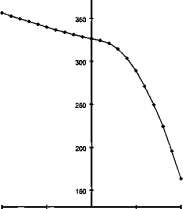
Figures 9.1-9.5 illustrate how the violent-crime rates vary before and
400-
300"
-10 -8 -6 -4 -2 0 2 4 6 8 10 Years before and after the adoption of concealed-handgun laws Figure 9.1. The effect of concealed-handgun laws on violent crimes

-10 -6 0 5 10
Years before and after the adoption of concealed-handgun laws
Figure 9.2. The effect of concealed-handgun laws on murders
8

-10-5 0 5 10
Years before and after the adoption of concealed-handgun laws Figure 9.3. The effect of concealed-handgun laws on rapes
140

I
-10 -5 0 5 10
Years before and after the adoption of concealed-handgun laws Figure 9.4. The effect of concealed-handgun laws on robberies
after the implementation of right-to-carry laws when both the linear and squared time trends are employed. Despite expanding the data through 1996 so that the legal changes in ten additional states could be examined, the results are similar to those previously shown in figures 4.5—4.9. 15 As in the earlier results, the longer the laws are in effect, the larger the decline in violent crime. The most dramatic results are again for rape and

9 "5
-10-5 0 5 10
Years before and after the adoption of concealed-handgun laws Figure 9.5. The effect of concealed-handgun laws on aggravated assaults
robbery rates, which were rising before the right-to-carry law was passed and falling thereafter. Robbery rates continue rising during the first full year that the law is in effect, but the rate of increase slows and begins to fall by the second year. It is this continued increase in robbery rates which keeps the violent crimes as a whole from immediately declining. While aggravated assaults were falling on average before the right-to-carry law was adopted, figure 9.5 shows that the rate of decline accelerated after the law went into effect.