Authors: Neil Johnson
Simply Complexity (7 page)

To help understand how frustration can arise in a Complex System, we go back to our files. Suppose that for some reason there is a rule that says that file A must not be placed next to C. This may sound unusual for an office but it often arises in a social setting. For example, teachers know that they cannot sit certain kids together because it will cause trouble – and the same can be true at dinner parties. The arrangement of the shelves themselves then becomes crucial. If they are in a line, the problem can be
solved as shown in the top of
figure 2.4
. But if they are in a circle, then it is impossible. In other words the arrangement is always frustrated as shown in the bottom of
figure 2.4
.

Figure 2.4
The dinner-party dilemma involving three people A, B and C, in which A and C do not want to sit together. Top: a rectangular table allows for a non-frustrated, relatively happy outcome. Bottom: a circular table always leads to frustration.
In addition to unhappy offices and dinner parties, frustration is also quite a common occurrence in the systems that physicists look at since there are certain types of particles – in technical jargon, particles with a certain type of spin – which don’t like to be next to each other. Stated more formally, such arrangements may have an unfavourably high energy.
While we are on the topic of physicists, it is worth noting
the
most important example of such biasing which occurs in the domain of Physics – the biasing of arrangements produced by the temperature at which a particular physical system is maintained. In fact the biasing due to temperature is so important to physicists that they have developed a huge amount of mathematical machinery for dealing with it, and have applied this machinery very successfully to many different types of laboratory system. Indeed this approach has been so successful in the Physics domain that many physicists have started trying to apply it to social systems. In particular, there are research papers written by physicists which talk about the “temperature” of a financial market. The problem is that
physicists tend to take the specific biasing that temperature causes too seriously. Just because this biasing is correct for physical systems like collections of molecules does not mean that it is also realistic for social ones. Indeed, as we have already discussed, a collection of inanimate objects tends to lack a key ingredient of a social system: feedback. As a result, it is unclear whether the conclusions from physical systems will have much relevance to Complex Systems in a biological or social setting.
But what exactly is the biasing caused by temperature and why is it such a big deal for physicists? In terms of our filing story, the biasing effect of temperature is analogous to that of a tired secretary who is getting ready to leave the office at night and who therefore only has a finite amount of energy available. This secretary will tend to put more files in the lower shelves than the upper ones, in order to save reaching up or having to stand on something. Likewise the amount of energy available to a physical system such as a collection of molecules, is restricted by its temperature. Continuing with the filing analogy, an outside observer who is checking the office’s filing arrangement night after night would be left with the impression that the filing system was reasonably well ordered, since the arrangements he observed would tend to be those shown in the middle and left-hand side of
figure 2.2
. Within the context of physics, the temperature controls the amount of energy available for arranging objects, and this in turn biases the arrangements. As the temperature increases, the amount of available energy increases, and so the biasing becomes less apparent. For the filing analogy, our office observer would then get the impression that the filing system was becoming less ordered since a wider range of arrangements would be observed over time. Eventually, at very high temperatures, the amount of energy available is huge – which is analogous to saying that the secretary has so much energy that she doesn’t bias the distribution of files among the shelves in any way. Since the filing process is now unbiased, our outside observer would conclude that the disorder is large since he would observe all possible arrangements of files among shelves with equal frequency.
Hence increasing the temperature in a physical system such as a collection of molecules, generally takes the system from an
ordered to a disordered state. The way in which water passes from ice at low temperatures to steam at high temperatures is a great example of this effect. Ice is a solid containing an ordered array of water molecules, while steam is a completely disordered gas. Physicists call the transitions between these different states of water, phase transitions – and the particular mathematical formula that they use to describe how the temperature biases arrangements of molecules is called an exponential or Boltzmann weighting factor. It seems that the popular press on Complexity likes to borrow this type of physics terminology related to phase transitions. However such literal translations of models and ideas from physics should be handled with care, since the biasing in arrangements caused by temperature is only strictly valid for systems such as a collection of molecules which sit in a particular type of laboratory environment. In short, physics has a remarkably large number of answers for certain types of systems – but it is still a long way from having all the answers for general Complex Systems.
Chaos and all that jazz
In the popular science literature, one often sees the term Complexity bundled together with another “C” word, Chaos. This might suggest that Complexity and Chaos are essentially the same thing. But they are not.
A Complex System tends to move between different types of arrangements in such a way that pockets of order are created – for example, the appearance and subsequent disappearance of a market crash. But we haven’t yet said anything about
when
such transitions might occur. In short, we are missing a discussion about time, or what is technically called the dynamics of the system. Given that a Complex System comprises a collection of interacting objects (for example, traders in a financial market), it is likely to exhibit quite complicated dynamics. In other words, the output of the Complex System as seen from the outside by any one of us will appear quite complicated. This word “output” just means any kind of observable number that is produced by the collection of objects. For example, the output of a financial market at any given moment is the price, e.g. $2.50 for a given stock. The fact that the output of a financial market (i.e. price) changes in time in such a complicated way is the reason that we, as outside observers, always see such complicated price-charts appearing in the news for stocks and currency exchange rates.
The way in which the output of a Complex System changes over time falls under the general heading of non-linear dynamics. And Chaos is just
one
particular example of such non-linear dynamics. In fact, the word “Chaos” is used when the system’s output varies so erratically that it seems random. The upshot of this statement is that those erratic-looking financial market price charts that we see in the news
could
show Chaos – but they don’t
have
to.
Let’s try to get to the bottom of all this talk of dynamics, Chaos and randomness, by going back to the office. As some of us know only too well, the way in which people in an office interact can dramatically affect the whole dynamics of the place, and hence can determine what happens to the office itself over time. The same is true for any Complex System. The way in which the constituent objects interact will affect the arrangements that they exhibit, how long they exhibit them for, and the transitions between these arrangements – and this will in turn affect the output of the system such as the price of a given stock. As we will see in
chapters 4
and
6
, the word “arrangement” in the context of a human system such as a financial market has to do with how the traders arrange themselves with respect to their possible trading strategies. This then determines whether they choose to buy or sell at a given moment – and this in turn gives rise to the price, or output, of the system. But it doesn’t matter whether it is files on shelves, or traders with trading strategies – it all still comes back down to a discussion of arrangements of objects.
If there are many possible arrangements of the system’s constituent objects, and the system moves in a complicated way between these arrangements, then the resulting output of the system can look random and unpredictable. It is under these conditions that the system might actually exhibit Chaos. If, instead, there is an obvious method to the madness, then the system can look ordered and predictable. The system will then not exhibit Chaos. As our filing story in
chapter 2
suggests, the presence of some kind of consistency or memory in the system can be crucial in determining whether the resulting evolution looks unpredictable or predictable, and hence whether it is likely to be Chaotic or not. So, given our interest in predictability, let’s now focus in detail on the effect of the intern in the office filing analogy. In
particular we wish to compare the dynamics generated by a systematic intern to the dynamics generated by a careless intern, in order to understand how the system’s output is affected by the way in which the underlying arrangements change. This will then help us understand the conditions under which a Complex System would be likely to exhibit Chaos. It will also help us understand the conditions under which a Complex System might be predictable.
Let’s start by considering the following setup.
One file, two shelves, and a systematic intern:
We will label the shelves as 0 and 1, as shown in
figure 3.1
. In the event that the file is on shelf 0, we will call this arrangement ’0’. In the event that the file is on shelf 1, we will call this arrangement ’1’.
Suppose that the file starts off on shelf 0, and imagine that our systematic intern has decided that he will, every day, enter the office and change the shelf on which the file sits. Hence the file changes from shelf 0 to 1 to 0 to 1, etc., which we can write as the sequence 0 1 0 1, etc. In other words, anyone noting down the file’s location at the end of each day would end up with the following sequence over a period of ten days:
0 1 0 1 0 1 0 1 0 1 . . .
This sequence of observations is referred to as the time-series of the system’s output, or simply the
output time-series.
The price-chart in
a financial market is another such time-series. For example, such a price-chart could conceivably look something like this:
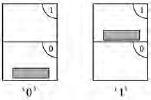
Figure 3.1
The two possible arrangements for one file and two shelves
$2.37 on day 0, $2.34 on day 1, $2.65 on day 2, $2.44 on day 3, $2.48 on day 4, $2.34 on day 5, $2.43 on day 6, $2.32 on day 7, $2.48 on day 8, $2.35 on day 9, $2.46 on day 10
which can be written more simply as
$2.37 $2.34 $2.65 $2.44 $2.48 $2.34 $2.43 $2.32 $2.48 $2.35 $2.46
This certainly looks like a lot of information. In fact, the detailed time-series that emerge from Complex Systems like financial markets can literally represent too much information for us humans to process. Many of us are really only able to take in whether the output (price) has gone up or down. In other words, instead of a long list of numbers we would instead think of a long list of ups and downs. If we write an “up” as 1 and a “down” as 0, then this would give a list of 1’s and 0’s. In our example above, the price goes
down
from $2.37 on day 0 to $2.34 on day 1 – hence this is a 0. By contrast, the price goes
up
from $2.34 on day 1 to $2.65 on day 2, which is a 1. Working out the changes in price from day to day in our example gives the following simplified version of the financial market price-series: