The Emperor Has No Clothes A Practical Guide for Environmental and Social Transformation (12 page)
Read The Emperor Has No Clothes A Practical Guide for Environmental and Social Transformation Online
Authors: John Hagen
Tags: #political, #nuclear power, #agriculture, #communes, #ethics planet earths future, #advertising manipulation, #environmental assessment, #history human, #energy development, #egalitarian society

36. If you wish to verify this for yourself,
here is an experimental setup: obtain 2 small inexpensive coolers
and place the same amount of some dark material inside each one to
absorb the sun, in one mix some baking soda and vinegar together
which produces carbon dioxide and quickly seal the top with clear
plastic wrap, take the second cooler and seal top with plastic wrap
(no vinegar & baking soda) place outside in the sun for awhile
and measure the temperature in each one. You will find that the one
with more carbon dioxide has a higher temperature .
As we can see in Fig. 3 average global
temperature increase closely follows the amount of carbon dioxide
increase in the air. Moreover, the temperature increase has also
been verified by sea level rise, which corresponds to water
expansion plus increases due to melt water. Furthermore, the
increases in sea level from melt water matches the reductions in
the amount of glacial and polar ice. The last step is to
demonstrate that human activities are producing the increase in
atmospheric carbon dioxide.
F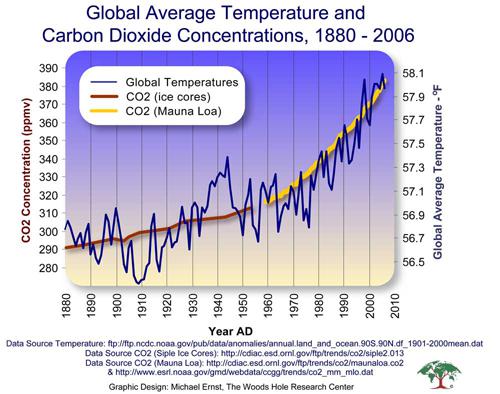 ig. 4 Courtesy of NOAA.
If we consider Fig. 4 we can see that there
is a further close correlation between the amount of carbon dioxide
being produced primarily through combustion of fossil fuels which
are released directly into the air and the amount of atmospheric
carbon dioxide increase.

Most of the carbon dioxide that we humans
have been adding to the air is absorbed by the oceans, and a
trivial amount by other bodies of water. So far this has prevented
a much larger global temperature increase which is good. The
absorption of carbon dioxide by water has mixed blessings though,
some of it is changed into carbonic acid. Carbonic acid is a weak
acid in the same strength range as the acid found in vinegar or
lemon juice. The strength of acids like carbonic and bases such as
dilute lye solutions are measured using pH, which has a range of 1
to 14, seven is neutral and each number represents a change of
strength of 10 times. In the last 100 years the average pH of ocean
water has changed from pH 8.16 to 8.07xxiii, which indicates a 30%
increase in acid strength. If you recall the baking soda and
vinegar experiment in foot note 33, chemically the baking soda is
named sodium bi-carbonate. The shell of shell fish is comprised of
a substance whose name is calcium carbonate, you will note that the
baking soda is part carbonate as well as the shell fish shell.
Acids dissolve the carbonate in shell in the same manner as the
baking soda. The result of the acidification of the oceans is that
shell fish are having difficulty surviving and have vanished from
some places. At the present time tests are being conducted to see
if large amounts of crushed clam shells placed in defunct shell
fish beds in Main are being conducted. This is being done in the
hope that the crushed shells will scavenge enough of the acid
locally from the sea to allow shell fish to be able to grow there
again.xxiv
Methane is another of the green house gasses,
40 % occur from natural sources and 60 % as a result of human
activities. It has 25 times the warming effect per molecule than a
molecule of carbon dioxide.[37] In the United States it accounts
for 9% of the green house gasses that are produced and remains in
the air for 12.4 years. The natural pre-industrial amount of
methane in the air was 715 ppm [38] and has risen to a present
value of 1,774 ppm as of 2005. The sources of methane are :
Natural Gas &
Petroleum...................30%
Ruminants
livestock[39].....................23%
Landfills..............................................17%
Coal
Mining........................................11%
Manure.................................................9%
Misc.....................................................7%
Waste Water
Treatment........................3%
37. Since 1990 the United States EPA
currently lists methane's green house strength as being 21 times
greater than carbon dioxide, however recently the EPA announced
that it was upping the value to 25X based upon more recent
research.
38. The natural range of atmospheric methane
for the last 650,000 years varied from 320 – 790 ppm.
39. The ruminant animals are: Cattle, sheep,
goats, buffalo, and camels.
The 40% of methane that is produced from
natural sources mostly comes from decaying vegetation and other
organic material by bacteria that thrive in oxygen free
environments, primarily from wetlands. Some other small natural
sources are termites, oceans, volcanoes, and wildfires.xxv
Water vapor also acts as a green house gas,
the amount present in the atmosphere is dependent upon temperature.
The warmer the temperature the greater the amount of evaporation
and also the ability of the air to retain moisture. This phenomena
can be easily seen when one takes a “tall cool one” from the
refrigerator on a hot humid day. The warm humid air is chilled on
the side of the cool glass and can not retain as much water vapor.
The water vapor condenses out on the glass causing the formation of
water droplets. Recent researchxxvi has confirmed that water vapor
traps a lot of solar energy. Dressler a researcher at Texas A&M
university has analyzed the new Aqua satellite [40] data compiled
from 2003 – 2008 said that, “water vapor feedback is
extraordinarily strong, capable of doubling the warming due to
carbon dioxide alone.”
40. The Aqua satellite has the capability of
measuring the humidity throughout the air column from the ground to
an altitude of 10 miles. It has allowed a great refinement of the
state of water vapor profiles over ground based measurements
alone.
Nitrous oxide is also a significant
greenhouse contributor, it is primarily produced by agricultural
activities. 69% of it originates from the use of synthetic nitrogen
fertilizers, especially of the ammonia types. An additional 5%
originates from manure, as a result of anaerobic (oxygen free)
fermentation. The conversion of fertilizer into nitrous oxide
occurs after it is applied to the fields by soil microbes which
convert some of the ammonia into this gas. This gas leaves the soil
and is released into the air. The remaining amounts come from
industry (9%), stationary combustion (6%), transportation (5%), and
miscellaneous (6%).xxvii This gas has 310 times the heat trapping
ability of carbon dioxide and remains in the air for 114 years. The
amount has increased from a pre-industrial level of 270 ppb to 319
ppb as of 2005.xxviii
Another group of greenhouse gasses are
chloroflourolcarbons (CFC's) that were developed for use in
refrigeration. The use of these substances were later expanded as a
means to pressurize spray cans, and as cleaning agents. They are
definitely a significant retainer of heat in the atmosphere, and
are comprised of a number of compounds some which have thousands of
times of the warming potential of carbon dioxide. CFC's can persist
in the atmosphere from a few decades to thousands of years. At the
present time, estimates of the contributions to atmospheric heating
ranges from being significant to major. The precise amount of
heating is controversial though, and we will have to wait to see
how things develop. These compounds are also the ones that destroy
ozone which protects us from excessive ultraviolet radiation.
Production of these compounds where banned in the 1980's by first
world countries. Some of the third world nations are still
producing these substances because they could not afford to replace
their refrigeration. As a result of the CFC ban the ozone hole over
the antarctic has recently started to shrink. Predictions by
experts indicate that the ozone shield should be largely restored
to its original size in about 50 years.
So far we have considered directly measurable
human induced inputs that can be seen to be producing the current
elevation of global temperature. Next we will try to peer into the
future by examining what the climate modelers are predicting.
Climatologists have developed sophisticated computer models for
climate prediction. The way these models are tested is by starting
them using the current weather conditions and then running them
backwards. These models are perfected by “tweaking” them until the
computer model can accurately produce predictions that correspond
to the known past climate. Once the model is able to predict the
known past climate it is then run forward to predict the future
climate. The climatologists examine different scenarios by varying
some of the factors the computer program uses such as the amount of
carbon dioxide, methane, etc., that may eventually be present in
the air. Generally a number of these models are run a number of
times using the differing values and then averaged. Since the
climate is extremely complex and the effects of the inputs are
highly variable these models are not able to produce very precise
highly detailed results.
The fundamental driving force that produces
weather is caused by the temperature differential between the
equatorial regions and the polar regions. In the warm equatorial
regions of the earth the air is heated which causes it to rise.
Once it arrives at the poles where it is cold the air cools and
sinks down. In order to keep providing air to supply these vertical
movements the warm air arriving at high altitudes is pulled toward
the polar regions to replace the cooled air that has sunk down. At
the same time the cool air from the poles move at low altitudes
toward the equatorial regions caused by air pressure differentials.
A simplified way of visualizing this is that these wind currents
are somewhat like a conveyor belt, with the warmed air on top
moving toward the polar regions, and the cooled air on the bottom
going back to the equator. Recent research by Francis et al., have
found that increases of air temperature caused by global warming
has produced faster warming of the arctic. Faster arctic warming
has caused a reduction of the temperature differential between the
warm southern regions and the arctic. At the present time the
arctic is warming at about twice the rate relative to the more
southern portions of northern hemisphere.xxix Since the arctic is
becoming warmer relative to the southern regions, the north south
air circulation is weakening. As a result of the weaker
circulation, the behavior of the jet stream which largely governs
our weather is changing. The jet stream progresses from west to
east and generally fluctuates up and down in waves with respect to
its latitude. As a result of the lower temperature differential the
jet stream circulation pattern has become more torpid, the progress
of the fluctuations have diminished. The slower progression of the
wave fluctuations result in weather patterns that are more
persistent. Greater persistence of weather patterns has the effect
of increasing the likelihood that “certain types of extreme
weather, such as drought, prolonged precipitation, cold spells, and
heat waves” (Francis, p 3) will take place.
The oceans are the other greatest contributor
to weather by providing moisture and acting as a sink for a great
deal of the pollutants we have been producing. They have been
absorbing 95.5% of the excess heat that is being produced by the
increasing amount of green house gasses in the air (see Fig. 1).
Like the convection currents in the air forming a “conveyor system”
the oceans have an analogous set of circulation patterns. The
warmed surface currents move poleward and upon their arrival sink
down. After sinking down they head back to the warming regions
along the bottom of the ocean (Fig. 5). A familiar example of this
system is the Gulf Stream which travels off the coast of North
America, crosses the Atlantic Ocean, and goes past the United
Kingdom. During it's travels these surface waters are evaporating
which increases the salt content producing greater density. The
salt content is further increased as a result of it's northward
progress to colder areas where the formation of ice withdraws some
additional fresh water. A further increase in the density of the
salty water is produced by reductions in it's temperature. The
combination of these factors eventually causes it to sink down into
the abyssal depths in the vicinity of Green Land and is referred to
as the thermohaline circulation. These warm surface currents have a
significant impact upon the climate in their vicinity. In the
United Kingdom and in other nearby coastal areas the climate is
moderated, in fact in Ireland one can find palm trees growing even
though it is at about the same latitude as Wisconsin where last
winters temperatures were occasionally -25 F.