Read The Norm Chronicles Online
Authors: Michael Blastland
The Norm Chronicles (50 page)

surgery
247
–59
Swine flu
71
synchronicity
77
syphilis, rates
83
,
90
T
tea, as drug
95
teenage pregnancy
89
terrorism
2
lie detectors
261
Thimerosal
71
Thompson, Hunter S.
98
,
101
,
180
tolerability of risk framework
201
TORINO scale, for asteroid risk
220
total fertility rate
88
trains
160
–65
transport
158
accidents
55
trepanation
251
Trier, Lars von
216
trust
167
Tungaska event
216
Tversky, Amos
49
U
uncertainty
157
,
224
,
260
,
264
aleatory
151
epistemic
151
unemployment
225
–33
V
vaccination
63
–71
HPV
67
smallpox
67
Value of a Statistical Life (VOSL)
18
,
165
variation around average
143
vehicles, number of
168
victim of violent crime, rates
244
Victoria, Queen
121
Vietnam, lottery
131
violence
31
–9
crime
244
on railways
162
volcano, Iceland
117
W
Wilde, Oscar
96
Willis, Bruce
219
wing-suit
176
Woolf, Virginia
48
World Health Organisation
68
,
169
,
253
World War II
17
*
The story of Anna Bagenholm comes from various sources, including
The Lancet
1
and Atul Gawande, in his book
Better
.
2
†
The usual phrase here is that Anna beat or defied the odds. Strictly speaking, no one can defy the odds. Odds simply describe how many people are expected to be on each side of a possibility. Even a million to one against when you turn out to be the one is not beating the odds: it
is
the odds.
*
What is a story? David Herman, editor of the
Routledge Encyclopaedia of Narrative Theory
, says: ‘Stories are accounts of what happened to particular people and of what it was like for them to experience what happened.’ That’ll do for us. It’s the ‘particular people’ bit that matters, which includes both fact and fiction. Specialists use the word ‘narrative’ to distinguish the way a story is told from the pure events, but this is not a book about narrative theory, although here and there we do talk about the story form – heroic medical stories in
Chapter 23
, for example.
*
There’s a tendency for women to be more risk-averse than men, but only on average. We are aware that we play with stereotypes all round.
*
Although, unlike falls from ladders, some numbers do change dramatically if some big casual factor has also changed, such as the decline in heart disease, largely from less smoking. Deaths from heart disease in men fell from 147 per 100,000 people in 2005 to about 108 per 100,000 in 2010, and for women from 69 to 48 per 100,000. These are huge changes.
*
Exactly the median birth weight recorded for children born in England, according to the latest available data, equal to about 7lb and 8oz.
2
†
For an explanation of what the 20 per cent increase in a risk does mean and how it’s calculated, see the discussion in
Chapter 4
, ‘Nothing’.
*
More precise figures: according to the Office for National Statistics, 18,000 people died from ‘external causes’ in England and Wales in 2010. That is all those people – out of the total population of 54 million – who died from accidents, murders, suicides and so on. This corresponds to an average of 18,000/54 = 333 MicroMorts per year for each person, or about 1 a day. It is not a perfect benchmark, not least because of the question of how to treat suicide, which is not quite an external event but is categorised as one. But it gives a reasonable approximation to the hazards of daily living, and – provided we keep everything on this same scale – it is all reasonably comparable.
*
Between May and October 2009, out of 9,000 UK service personnel in Afghanistan, 60 were killed.
6
This works out at around an average of 47 MicroMorts a day, or 1 MicroMort per half-hour. Between 1939 and 1945, 55,000 bomber crew were killed in 364,000 missions. With an average crew size of around 6, that is around 25,000 MicroMorts per mission, or roughly 1 MicroMort per second.
†
The chance of this happening is a half (heads or tails) times a half, repeated 20 times (1 in 2
20
), which is roughly equal to 1 in a million.
*
‘Once she was born I was never not afraid. I was afraid of swimming pools, high-tension wires, lye under the sink, aspirin in the medicine cabinet, The Broken Man himself. I was afraid of rattlesnakes, riptides, landslides, strangers who appeared at the door, unexplained fevers, elevators without operators and empty hotel corridors. The source of the fear was obvious: it was the harm that could come to her.’ Joan Didion,
Blue Nights
1
*
Assuming it’s all on British roads. The risks on an Afghan pass are probably higher.
*
Although infant mortality had fallen sharply up to 1921, it still accounted for a staggering 82 babies out of every 1,000 born in 1921. Then it dropped sharply in only a generation, to 46 in 1945. By 1983 it was down to 10, and it is about 4 now.
*
2,000 is the capacity of the Empire cinema in London’s Leicester Square.
*
See Hans Rosling’s Gapminder project (
www.gapminder.org
) for brilliant demonstrations of this.
*
A growing fear for children has been dated to the 1960s, with the emergence of battered child syndrome, followed by runaways and Halloween sadism in the late 1960s, sexual abuse, child pornography and child-snatching in the 1970s and missing children and ritual satanic abuse in the 1980s.
1
†
Although there is a problem with this ‘rare is worse’ feeling. If it also suggests the obverse – that ‘more common is not so bad’ – then it is not so far from the attitude that life is cheap in developing countries: ‘So many people die, can it hurt much to lose another?’ Readers must decide whether a fatal event feels worse if it is also more unlikely.
*
In 2010 it was widely reported that the risk for all children under 15 had fallen sharply over the years, to the extent that the BBC and others repeated claims that it was about 40 per cent lower than in the early 1970s.
3
This is unlikely. Those figures are largely a result of changes in the late 1970s to the way cases were recorded while still awaiting the outcome of criminal proceedings. This problem does not affect the MicroMort figures we use for homicides, which are based on consistent methodology, and although the odds we have stated will be wrong in the sense that they are not precise, they will be right enough.
*
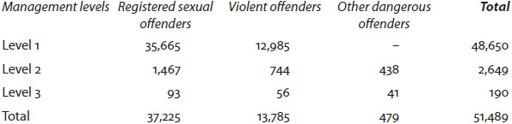
MAPPA gives all these figures in more detail.
7
*
In 2010 there were
no
pedestrian deaths in this category.
*
We use two main ONS sources for accidental deaths: one defines ‘avoidable’ death and is derived from the other – a longer series – that simply counts all causes of mortality. The graphics here use the avoidable deaths series.
*
Between 1958 and 1960, 957,000 cases of measles were reported, of whom 178 died.
*
The average number of people infected is called the
basic reproduction number
and given the symbol R0 (R-nought) – for smallpox it is around 5, for measles around 12.
†
Suppose the community had been vaccinated, to the extent that more than 4 out of 5 people (80 per cent) were immune. In this case, someone with smallpox would on average only infect less than 1 new person, and so the epidemic would die out. So we get the nice general result that an epidemic will die out provided that of every R0 people, at least (R0 – 1) are immune, so the proportion that need to be immune is (R0 – 1)/R0. For example, to prevent a measles epidemic (12 – 1)/12 = 11/12 = 92 per cent of the population need to be immune, whereas the swine flu virus in 2009 was a lazy thing whose R0 was only around 1.3, and so only 0.3/1.3 = 23 per cent had to be immune to stop the epidemic. Since vaccines are not 100 per cent effective, in practice the aim is to vaccinate a greater proportion than this, at least 95 per cent in the case of measles. Of course, it’s possible to get a ‘free ride’ by not having the vaccination yourself, and relying on everyone else to stop an epidemic.
The current (2011) English vaccination rates for measles
9
are 89 per cent, up from 80 per cent in 2003 but still not back to the 92 per cent in 1995, let alone the 95 per cent recommended by the World Health Organisation (WHO). After an outbreak of measles in Liverpool in February 2012, the Health Protection Agency revealed that 7,000 Merseyside children under the age of 5 had not had their full measles vaccine. Measles is the first M in the MMR vaccination, and coverage went down after the highly publicised claim in 1998 that MMR was associated with autism. This claim has now been discredited, although it continues to have strong supporters in the US – just try searching on ‘vaccine autism’.
*
There is some nice, fairly simple maths that allows you to work out how many people you need for a good chance of a match for any characteristic.
15
Suppose that any two people have a 1 in
C
chance of matching – for example, for an exact birthday match,
C
= 365. Then to have a 50 per cent chance of a match in a group of
N
people,
N
needs to be around 1.2 √
C
. For a birthday match, this means that we need around 1.2 √365 = 23 people, as claimed above. For a 95 per cent chance of a match, we need to approximately double this number, to 2.5 √
C
. So if we have
N
= 2.5 √365 = 48 people in a room, it is very likely indeed that two will have the same birthday.
This makes it easy to make money off people. Suppose you have 30 people together. Bet the group that two have a birthday within one day of each other. What are the chances you will win? First, consider the chance that any two people (say Me and You) match in this way: if My birthday is 16 August, then a match would happen if You were born on the 15th, 16th or 17th, which is 3 out of 365 days, or a 1 in 122 chance, so
C
= 122. So for a 50 per cent chance of a match we only need 1.2 √122 = 13 people, and for a 95 per cent chance we need 2.5 √122 = 28 people. So with 30 people in a room you are almost certain to win. You might send us a cut of your winnings.