Why Growth Matters (13 page)
Read Why Growth Matters Online
Authors: Jagdish Bhagwati

Adult weights and heights, which are more direct measures of nutrition, do show steady even if slow improvements. According to the NNMB surveys to which we have previously alluded, the population with below-normal body mass index (BMI) of 18.5 fell from 56 percent to 33 percent for men and from 52 percent to 36 percent for women between 1975â1979 and 2004â2005 (Deaton and Drèze 2009, Table 10). In absolute terms, the proportions of men and women with below-normal BMI
prevailing in 2004â2005 are high when seen in an international context. But this is an issue relating to the
level
, not
change
, which is the center of concern of those focusing on increased hunger.
The purpose of pushing back against the critics is not to suggest for a moment that all is well with child and adult nutrition in India. We fully appreciate that despite the progress it has made, India remains very far from the progress made by the developed countries in all aspects of health including child and adult nutrition and therefore has a long way to go.
But this requires a proper assessment of where precisely the greatest deficiencies are so that scarce revenues are spent prudently. Overstating problems has its own hazards: if healthy children are designated as malnourished, we might push them toward obesity and, likewise, if we misdiagnose the problem of a lack of proper balance in diet as one of low calorie consumption, we would erroneously push calorie consumption.
.
Thanks in part to the UNDP advocacy of its policy experience as a role model for development, the “Kerala model” has gained an iconic status in some development circles in both India and abroad. The view in these circles is that the Kerala model has successfully delivered ultra-high achievements in both education and health despite its low incomes and slow growth through redistribution and efficient public spending. But the claim crumbles in the face of careful scrutiny.
True, the evidence is unequivocal that Kerala has the best all-around education and health indicators among the major Indian states. Its literacy rates for both males and females and life expectancy are higher and the rates of infant mortality, maternal mortality, and malnutrition are lower than for all other larger states in India. The superior education and health outcomes in Kerala are not in question.
But the evidence that there is a clearly identifiable Kerala model to which these superior outcomes can be attributed is absent. Authors Richard Franke and Barbara Chasin (1999) offer a definition, but be
yond the redistribution of land, it is descriptive of the Kerala experience rather than a set of policies that other states could potentially emulate.
8
As we noted earlier, land redistribution as an instrument of poverty alleviation was well known to Indian planners and was tried all over India but its implementation failed due to political opposition.
9
Amartya Sen is also said to have talked about a “Kerala model” but George Mathew (2001) has contradicted this: “Dr. Amartya Sen during his recent visit to Kerala repudiated the argument that there is what is called a Kerala model, and disclaimed that he had ever used the term. At best, what has happened is Kerala's experience of development.”
10
There are four observations to be made about Kerala's developmental approach and outcomes.
First, if redistribution has been at the heart of its achievements, as it is widely believed, we should find a relatively low level of and a significantly declining trend in inequality in the state. Yet, according to the 2004â2005 NSSO expenditure survey, Kerala exhibits the highest degree of inequality among the fifteen largest Indian states. It is possible that Kerala had greater success in redistributing land than other states, but that has certainly not translated into a more egalitarian distribution of expenditures than in the rest of the country. Likewise, inequality fails to show a declining trend. Rural and urban inequalities in Kerala did fall between 1983 and 1993â1994 but they rose back in 2004â2005 to levels well above those in 1983. The significant decline in poverty between 1983 and 2004â2005 could not be explained by the trend in inequality.
Second, Kerala began with a huge advantage in literacy over the rest of the country at independence. Since then, it is hard to find anything spectacular or unique in outcomes in Kerala. This is shown in
Figure 5.4
, which plots the evolution of literacy rates in Kerala, Maharashtra Gujarat, and India. Maharashtra began with a 20 percentage-point disadvantage vis-Ã -vis Kerala in 1951. By 2011, the disadvantage had been reduced to 11 percentage points. Gujarat began with a 25 percentage-point gap but narrowed it to 15 percentage points. Similar narrowing of the gap can be observed with respect to the India-wide average.
The historical advantage of Kerala can also be observed in the indicators of health. Here we do not have ready access to the data from 1951
but we do have the series on life expectancy and infant mortality rates beginning in the early 1970s.
In
Figure 5.5
, we show the life expectancy at birth from 1970â1975 to 2001â2005 at five-year intervals in three high-achiever states: Kerala, Maharashtra, and Tamil Nadu. Maharashtra begins with an eight-year disadvantage and Tamil Nadu with a twelve-year disadvantage vis-Ã -vis Kerala. But the gap narrows to approximately seven years in each case by 2001â2005. A similar story unfolds in the infant mortality rate. The gap of more than forty-five deaths per 1,000 live births vis-Ã -vis Kerala in Maharashtra and Tamil Nadu in 1971 is reduced to less than twenty in 2009 in each case.
Third, advocates of the Kerala model argue that the state's achievements with respect to poverty, education, and health are to be distinguished from those of other states because it has done so despite its low per capita income and poor growth performance. Clearly, low per capita income and a high Gini coefficient (i.e., unequal distribution of expenditures) and yet low levels of poverty in relation to other states cannot all be true simultaneously. What gives way is the per capita income.
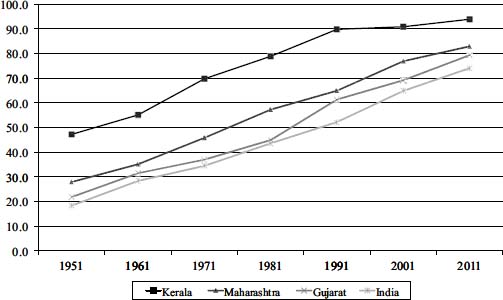
Figure 5.4. Literacy rates in Kerala, Gujarat, Maharashtra, and India, 1951â2011
Source: Authors' construction based on data from the Census of India, various rounds
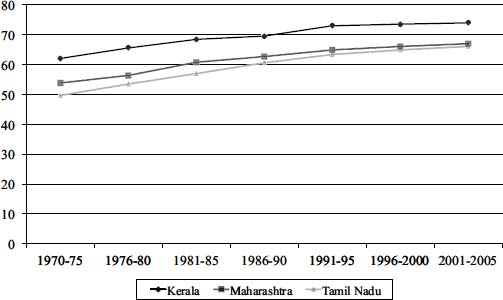
Figure 5.5. Life expectancy at birth in Kerala, Maharashtra, and Tamil Nadu, 1970â2006
Source: Authors' construction based on estimates from Sample Registration Bulletins, Census of India, various issues
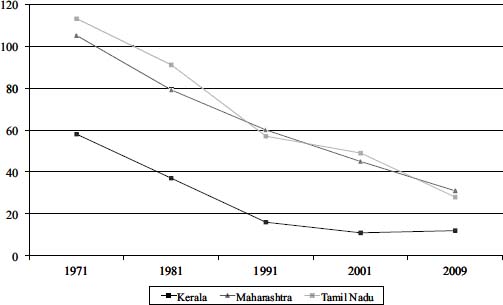
Figure 5.6. Infant mortality rate per 1,000 live births in Kerala, Maharashtra, and Tamil Nadu, 1971â2009
Source: See
Figure 5.5
As Chakraborty et al. (2011) show, once the available gross state domestic product (GSDP) data are converted to the common 2004â2005 base and appropriate population series used to obtain
per capita
GSDP, Kerala consistently ranks among the top five of the largest fifteen states by this measure beginning in 1980â1981, the year from which the GSDP series is available on a continuous and consistent basis.
11
The picture is even more dramatic when we consider per capita expenditure. According to the latest large-scale expenditure survey, conducted in 2009â2010, Kerala tops the list of the larger states ranked by per capita expenditures in both rural and urban areas. High achievements of Kerala in poverty alleviation, health, and education are associated with high, not low, per capita incomes and expenditures.
Finally, the claim by the proponents of the Kerala model that the state achieved superior health and education outcomes through significantly more activist state interventions also turns out to be implausible. Once again, at least the available data do not reveal anything out of the ordinary. During the twenty years from 1991â1992 to 2010â2011 for which we are able to obtain public-health expenditures data for the major states, per capita public expenditures on health turn out to be by far the highest in Goa. Indeed, it is consistently three times the per capita public health expenditure in Kerala. Excluding Goa, Kerala spends more than its nearest rival state in eleven out of the twenty years. This may give some credence to the Kerala model except that the expenditures themselves are not all that large: except in the recent three or four years, they rarely exceed 1 percent of the GSDP.
What turn out to be far more impressive for Kerala are the
private
health expenditures. These data are available for each state for two years and they are by far the highest of any state (including Goa) in Kerala both on a per capita basis and as percent of the GSDP. Thus, for example, in 2004â2005 per capita private expenditure in Kerala was 2,663 rupees per annum with the nearest rival, Punjab, spending only 1,112 rupees. In comparison, per capita public expenditures of the two states in the same year were 280 and 234 rupees, respectively. Good health in Kerala is being financed predominantly by private expenditures (and this
also may have something to do with the influx of massive remittances from the Middle East, which again would call into question the generally antiglobalization attitudes of the proponents of the Kerala model).
This dominance of the private sector is also observed in education. The NGO Pratham has been conducting extensive surveys of children in school up to sixteen years of age in rural India in recent years. In its latest report (ASER 2010) it finds that, with the exception of two or three tiny northeastern states, Kerala has the highest proportion of students between ages seven and sixteen in private schools in rural areas. At 53 percent, it leads its nearest rival, Haryana, by a margin of 13 percentage points. The conventional and dominant story of Kerala as a state-led success in the postindependence era simply does not stand up to a careful empirical investigation.
When confronted with the evidence contained in our second observation above relating to the lackluster performance of Kerala in terms of the
progress
in the social indicators in the postindependence era, proponents of the Kerala model counter that this comparison is misleading because each percentage-point improvement gets harder as we reach higher and higher levels of achievement. For example, it is much harder to improve literacy from 50 percent to 60 percent than from 20 percent to 30 percent.
But there are at least three reasons why this defense is implausible:
      Â
â¢
 Â
There is no compelling reason that the going should get rougher as the level of an indicator rises. True, the
scope
for improvement in literacy is less the closer the level of literacy to 100 percent, but this need not translate into slower progress on the margin. Indeed, one can think of many reasons that the going might get easier as the literacy rate rises: the social pressure on a family to impart literacy to its children will rise with the proportion of literate children in its neighborhood. As the level of literacy rises, the pressure on the government to do something about those left behind also rises. Besides, with low levels of literacy, teachers are not easy to find since the handful of the literate are much in demand in other occupations.