Why Growth Matters (17 page)
Read Why Growth Matters Online
Authors: Jagdish Bhagwati

To put the matter concretely, South Korea grew at an annual rate of 8.3 percent between 1965 and 1980. During this period, the proportion
of the workforce employed in agriculture in the country fell by 25 percentage points from 59 percent to 34 percent. Simultaneously, the workforce employed in industry rose from 10 percent to 23 percent and in services from 31 percent to 43 percent. Alongside, real wages grew at 11 percent per year.
In sharp contrast, the share of agriculture in employment in India fell proportionately so gradually that, with the workforce growing, the absolute number of workers in this sector actually rose between 1993â1994 and 2004â2005. With the output share of agriculture having shrunk to 20 percent in 2004â2005, an extremely large proportion of the workforce depends on a very small proportion of income. Further Track I reforms are needed to create good jobs for these underemployed workers.
It may be observed that these twin reasons for Track I reformsâaccelerating growth and making it more inclusiveâare mutually reinforcing. Productivity growth requires moving workers from low-productivity agriculture into high-productivity industry and services and from the informal to the formal sector within industry and services. These same processes would also make growth more inclusive.
We begin the next chapter with a diagnosis of why Indian entrepreneurs have shied away from employing unskilled and low-skilled workers despite their vast numbers in the country and what corrective reforms are required.
A Multitude of Labor Laws and Their Reform
The time has come for all of us to seriously consider whether the present labor laws, and the machinery for their implementation, need reforms to enable Indian exporters to tap the vast opportunities in the global market. It is my belief that the right kind of labor reforms will simultaneously protect the legitimate interests of the workers, create more employment, and sharpen the competitive edge of Indian exports.
â
Prime Minister Atal Bihari Vajpayee in a speech accompanying the presentation of the National Export Awards, New Delhi, January 21, 1999
Is it possible that our best intentions for labor are not actually met by laws that sound progressive on paper but end up hurting the very workers they are meant to protect?
â
Prime Minister Manmohan Singh in a speech to trade unions, November 23, 2010
T
ransition from a poor agrarian economy to a modern one typically involves three key transformations: first, movement of workers out of agriculture into industry and services; second, progressive shift of workers from the informal to the formal sector within industry and services; and third, more rapid urbanization, which follows the shift to formal-sector manufacturing and services, which are likely to be in urban areas.
Regarding the last transformation, even if the industry happens to locate itself in or near a region that is rural, it turns the latter urban. The most dramatic example of this is the Pearl River delta in China, which
was dominated by farms and villages until as recently as 1985 but has been transformed into a collection of mega-urban centers by the industrialization that followed economic reforms. Prior to that, Singapore went through a similar transformation. Either way, industrialization and modernization go hand in hand with urbanization.
The three transformations were at the heart of the modernization of such countries as South Korea and Taiwan during their fast-growth phases in the 1960s and 1970s. They have also characterized China recently. How does India stack up on these dimensions?
Despite a significant decline in the output share, the employment share of agriculture in India has remained high. Moreover, employment in industry and services also remains predominantly in small, informal firms characterized by low productivity. Consequently and unsurprisingly, urbanization has also proceeded relatively slowly.
Based on the census conducted once every decade, the proportion of urban in total population rose just 14 percentage points in six decades, from 17.3 percent in 1951 to 31.1 percent in 2011. The pace seems to have accelerated in the past decade with a 3.3-percentage-point gain but this is hardly adequate for transition to a modern economy. In contrast, China went from 19 percent urbanized population in 1980 to 45 percent in 2008, representing an average gain of 9.3 percentage points per decade. South Korea urbanized even faster during the 1960s and 1970s.
At the heart of this slow progress along all three dimensions is the flight of Indian entrepreneurs in the formal sector from low-skilled labor. It is ironic that in a country with nearly 470 million workers, all evidence indicates extreme and even increasing reluctance of Indian entrepreneurs to employ unskilled workers. The number of workers in
all
private-sector establishments with ten or more workers rose from 7.7 million in 1990â1991 to just 9.8 million in 2007â2008. Employment in private-sector
manufacturing
establishments of ten workers or more rose, on the other hand, only from 4.5 million to 5 million over the same period.
1
This small change has taken place against the backdrop of a much larger num
ber of more than 10 million workers joining the workforce every year. Three key factors are behind this dismal picture.
A common feature of the fast-growing low-income countries has been rapid expansion of manufacturing, with the latter pulling unskilled workers from agriculture into gainful employment. This pattern characterized the rapid growth in Taiwan and South Korea in the 1960s and 1970s and in China more recently. Today's industrial economies, such as the United Kingdom, Germany, and the United States, also exhibited a similar pattern when they transformed themselves from primarily agricultural to nonagricultural economies.
But this pattern has failed to emerge in India despite rapid growth. The share of manufacturing in GDP actually fell from 16.8 percent in 1981â1982 to 15.8 percent in 2008â2009. Insofar as manufacturing is often a major source of gainful employment in a low-income but growing economy, its slow growth has been behind the slow movement of the workforce out of agriculture.
Even with a stagnant share of manufacturing, some impetus to gainful employment of the unskilled could have come from a shift in the output composition of organized-sector manufacturing in favor of unskilled-labor-intensive and against capital- and skilled-labor-intensive activities.
2
Unfortunately, this did not happen either.
In a recent study, Das, Wadhwa, and Kalita (2009) analyze precisely this issue, using output and input usage data on ninety-six manufacturing sectors in the organized sector from 1990â1991 to 2003â2004. They identify thirty-one of these industries, such as food and beverages, apparel, textiles manufacture, and manufacture of furniture, as labor-intensive. These sectors accounted for only 12.94 percent of the gross value added in organized manufacturing in 1990â1991. Thus, the labor-intensive sectors were relatively unimportant in overall manufacturing to begin
with. But then they remained so: their share rose to 15.9 percent in 2000â2001 and fell back to 12.91 percent in 2003â2004. And in all likelihood, this share has further declined since 2003â2004. In fact, some of the fastest-growing industries between 2003â2004 and 2010â2011 have been automobiles, two-and three-wheelers, petroleum refining, engineering goods, telecommunications, pharmaceuticals, finance, and software. All these industries are either capital-intensive or skilled-labor-intensive.
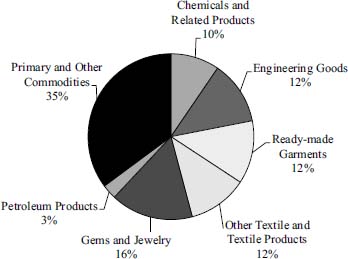
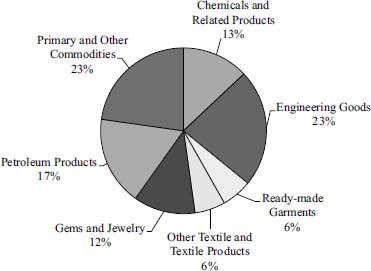
What about exports? The changes in the composition of merchandise exports of India corroborate the shift in production share toward capital-intensive goods. As
Figure 8.1
shows, engineering goods, chemicals and related products, gems and jewelry, and petroleum products, which are either capital-intensive or semi-skilled-labor-intensive, accounted for 41 percent of the total merchandise exports of India in 1990â1991. The share of these products had, however, come to account for 65 percent of the total merchandise exports by 2007â2008. At the other extreme, ready-made garments, which are among the most unskilled-or low-skill-intensive products, saw their share decline from 12 percent to just 6 percent during the same period. Engineering goods and petroleum products, both highly capital-intensive products, witnessed the largest expansion.
Clothing and accessories offer a telling example of the poor showing of India in the world markets for labor-intensive products.
3
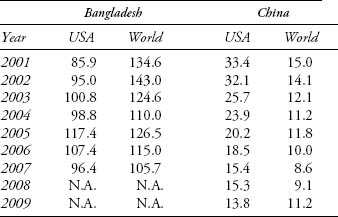
These products represent an extremely large world market and formed China's leading exports in the 1980s and 1990s. Indeed, even though electrical and electronic products have emerged as the country's leading exports since the early 2000s, China continues to dominate the market for clothing and accessories. In contrast, India has scarcely been able to keep up with much smaller Bangladesh.
This is evident from
Table 8.1
, which shows the exports of clothing and accessories by India as percent of those by Bangladesh and China in the 2000s. The exports from India to the United States were approximately the same as those by Bangladesh between 2001 and 2007. As regards the exports to the world as a whole, India had a more than 40 percent lead over Bangladesh in 2002. But it steadily lost ground, with its exports exceeding those of Bangladesh by just 5.7 percent in 2007.
1990â91 : Total Merchandise Exports: $18.1 Billion

2007â08: Total Merchandise Exports: $163.1 Billion

Figure 8.1. Composition of merchandise exports by India in 1990â1991 and 2007â2008
Source: Authors' construction using the statistics from Directorate General of Commercial Intelligence and Statistics
Table 8.1. Exports of clothing and accessories (SITC 84) by India as percent of those by Bangladesh and China

Source: Authors' calculations based on the United Nations Commodity trade data
When compared to China, India fares quite poorly in both the US and world markets. Even after the emergence of electronic products as its largest exports, China's lead in clothing and accessories over India has widened considerably. In the US market, India's exports as a proportion of Chinese exports fell from one-third to less than one-seventh between 2001 and 2009. The end to the multifiber arrangement under the Uruguay Round Agreement on Textiles and Clothing clearly exposed the inefficiency of the Indian industry vis-Ã -vis Bangladesh and China.
A final avenue to raising gainful employment of the unskilled could have been a shift toward more labor-intensive technologies. But even here, the evidence points to movement away from rather than toward labor. Indian firms use more capital-intensive techniques in production in relation to India's factor endowments to begin with, and technology has moved still further in this direction over the years.
Hasan, Mitra, and Sundaram (2010) show that laborâcapital ratios in the vast majority of manufacturing industries in India are lower than
in other countries at a similar level of development and with similar factor endowments. Comparing India and China in nineteen manufacturing industries, for example, they show that the capital stock per worker in India is consistently higher in India than in China, in the period 1980â2000. They also find India's growth in capital stock per worker from 1980 to 2000 in these sectors is higher than that in China. It is not surprising, then, that whereas employment in these sectors shows steady growth in China, it has been stagnant in India.
4