Data Mining (73 page)
Authors: Mehmed Kantardzic

For the previously given vectors x
1
and x
2
, the corresponding cosine measure of similarity is s
cos
(x
1
, x
2
) = (2 + 0 − 3 + 0)/(2
½
· 15
½
) = −0.18.
Computing distances or measures of similarity between samples that have some or all features that are noncontinuous is problematic, since the different types of features are not comparable and one standard measure is not applicable. In practice, different distance measures are used for different features of heterogeneous samples. Let us explain one possible distance measure for binary data. Assume that each sample is represented by the n-dimensional vector x
i
, which has components with binary values (v
ij
∈ {0,1}). A conventional method for obtaining a distance measure between two samples x
i
and x
j
represented with binary features is to use the 2 × 2 contingency table for samples x
i
and x
j
, as shown in Table
9.2
.
TABLE 9.2.
The 2 × 2 Contingency Table
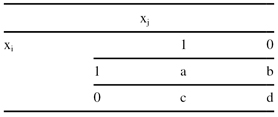
The meaning of the table parameters a, b, c, and d, which are given in Figure 6.2, is as follows:
1.
a
is the number of binary attributes of samples x
i
and x
j
such that x
ik
= x
jk
= 1.
2.
b
is the number of binary attributes of samples x
i
and x
j
such that x
ik
= 1 and x
jk
= 0.
3.
c
is the number of binary attributes of samples x
i
and x
j
such that x
ik
= 0 and x
jk
= 1.
4.
d
is the number of binary attributes of samples x
i
and x
j
such that x
ik
= x
jk
= 0.
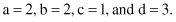
For example, if x
i
and x
j
are 8-D vectors with binary feature values
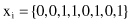
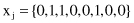
then the values of the parameters introduced are
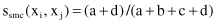
Several similarity measures for samples with binary features are proposed using the values in the 2 × 2 contingency table. Some of them are
1.
simple matching coefficient (SMC)
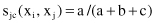
2.
Jaccard Coefficient
3.
Rao’s Coefficient
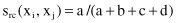
For the previously given 8-D samples x
i
and x
j
these measures of similarity will be s
smc
(x
i
, x
j
) = 5/8, s
jc
(x
i
, x
j
) = 2/5, and s
rc
(x
i
, x
j
) = 2/8.
How to measure distances between values when categorical data are not binary? The simplest way to find similarity between two categorical attributes is to assign a similarity of 1 if the values are identical and a similarity of 0 if the values are not identical. For two multivariate categorical data points, the similarity between them will be directly proportional to the number of attributes in which they match. This simple measure is also known as the
overlap measure
in the literature. One obvious drawback of the overlap measure is that it does not distinguish between the different values taken by an attribute. All matches, as well as mismatches, are treated as equal.
This observation has motivated researchers to come up with data-driven similarity measures for categorical attributes. Such measures take into account the frequency distribution of different attribute values in a given data set to define similarity between two categorical attribute values. Intuitively, the use of additional information would lead to a better performance. There are two main characteristics of categorical data that are included in new measures of similarity (distance):
1.
number of values taken by each attribute, n
k
(one attribute might take several hundred possible values, while another attribute might take very few values); and
2.
distribution f
k
(x), which refers to the distribution of frequency of values taken by an attribute in the given data set.
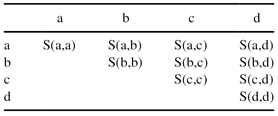
Almost all similarity measures assign a similarity value between two d-dimensional samples X and Y belonging to the data set D as follows:
where
S
k
(
X
k
,
Y
k
) is the per-attribute similarity between two values for the categorical attribute A
k
. The quantity
w
k
denotes the weight assigned to the attribute A
k
. To understand how different measures calculate the per-attribute similarity,
S
k
(
X
k
;
Y
k
), consider a categorical attribute A, which takes one of the values{a, b, c, d}. The per-attribute similarity computation is equivalent to constructing the (symmetric) matrix shown in Table
9.3
.
TABLE 9.3.
Similarity Matrix for a Single Categorical Attribute