More Guns Less Crime (16 page)
Read More Guns Less Crime Online
Authors: John R. Lott Jr
Tags: #gun control; second amendment; guns; crime; violence

To make sure that these differences were not due to some other factor, I reestimated the specifications used earlier to explain murder rates for the state-level regressions with time trends before and after the adoption of the nondiscretionary concealed-handgun laws. The variable being ex-
Table 5.3 Mass shooting deaths and injuries
Mean death and injury rate per year for years in which the states do not have nondiscretionary concealed-handgun laws
(i)
Mean death and injury rate per year for years in which the states do have nondiscretionary concealed-handgun laws (2)
Number of mass shooting deaths and injuries for the ten states that changed their laws during the 1977-1992 period
Mass shooting deaths and injuries per 100,000 population for the ten states that changed their laws during the 1977—1992 period
A. Comparing the before-and-after mean mass shooting deaths and injuries for states that changed their concealed-handgun laws during the 1977—1992 period 1
1.63
0.039
1.19
0.012
Number of mass shooting deaths and injuries Mass shooting deaths and injuries per 100,000 population
B. Comparing the mean mass shooting deaths and injuries for all states with nondiscretionary concealed-handgun laws and those without such laws 2
2.09 0.041
0.89 0.037
'Column 1 for section A has 128 observations; column 2 has 32 observations. HZolumn 1 for section B has 656 observations; column 2 has 160 observations.
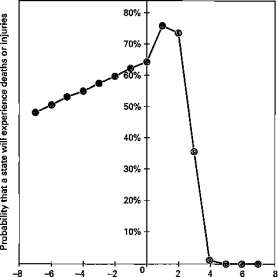
Years before and after the adoption of concealed-handgun laws
Figure 5.1. Probability that the ten states that adopted concealed-handgun laws during the 1977—1992 period experienced deaths or injuries from a shooting spree in a public place
plained is now the total number of deaths or injuries due to mass public shootings in a state. 5
Figure 5.1 shows that although the total number of deaths and injuries from mass public shootings actually rises slightly immediately after a nondiscretionary concealed-handgun law is implemented, it quickly falls after that, with the rate reaching zero five years after the law is enacted. 6 Why there is an initial increase is not immediately obvious, though during this early period relatively few people have concealed-handgun permits. Perhaps those planning such shootings do them sooner than they otherwise would have, before too many citizens acquire concealed-handgun permits. One additional qualification should also be made. While nondiscretionary concealed-handgun laws reduced deaths and injuries from mass public shootings to zero after five years in the ten states that changed their laws during the 1977 to 1992 period, a look at the mean death and injury rates from mass public shootings in the eight states that passed such laws before 1977 shows that these rates were quite low but definitely not zero. This tempers the conclusion here and implies that
VICTIMS AND THE BENEFITS FROM P ROT E CT I O N / 103
while deaths and injuries from mass public shootings fall dramatically after nondiscretionary concealed-handgun laws are passed, it is unlikely that the true rate will drop to zero for the average state that adopts these laws.
County Data for Arizona, Pennsylvania, and Oregon, and State Data for Florida
One problem with the preceding results was the use of county population as a proxy for how restrictive counties were in allowing concealed-handgun permits before the passage of nondiscretionary laws. Since I am still going to control county-specific levels of crime with county dummies, a better measure would have been to use the actual change in the number of gun permits before and after the adoption of a concealed-handgun law. The per-capita number of permits provides a more direct measure of the expected costs that criminals face in attacking people. Knowing the number of permits also allows us to calculate the benefit from issuing an additional permit.
Fortunately, the information on the number of permits issued by county is available for three states: Arizona, Oregon, and Pennsylvania. Florida also provides yearly permit data at the state level. Arizona and Oregon also provided additional information on the conviction rate and the mean prison-sentence length. However, for Oregon, because the sentence-length variable is not directly comparable over time, it is interacted with all the individual year variables, so that we can still retain any cross-sectional information in the data. One difficulty with the Arizona sentence-length and conviction data is that they are available only from 1990 to 1995, and since the nondiscretionary concealed-handgun law did not take effect until July 1994, we cannot control for all the other variables that we control for in the other regressions.
Unlike Oregon and Pennsylvania, Arizona did not allow private citizens to carry concealed handguns prior to July 1994 (and permits were not actually issued until the end of the year), so the value of concealed-handgun permits equals zero for this earlier period. Unfortunately, however, because Arizona changed its law so recently, I cannot control for all the variables that I controlled for in the other regressions. Florida's data are even more limited, but they allow the study of the simple relationship between crime and permits at the state level for a relatively long period of time.
The results in table 5.4 for Pennsylvania and table 5.5 for Oregon provide a couple of consistent patterns. 7 The most economically and statistically important relationship involves the arrest rate: higher arrest rates consistently imply lower crime rates, and in twelve of the sixteen regres-
Table 5.4 Crime and county data on concealed-handgun permits: Pennsylvania counties with populations greater than 200,000
Crimes per 100,000 population
Percent change in the crime rate
Violent crime
Murder Rape
Aggravated Property Auto
assault Robbery crime theft
Burglary Larceny
Due to a 1 percent change -5.3%** -26.1%* -5.1%** -4.8%**
in the number of right-to-carry pistol permits/ population over 21 between 1988 and each year since the law was implemented
Due to a 1 percent change -0.79%* -0.37%* -0.08% -0.76%*
in the arrest rate for the crime category
1.2%
-0.12%
1.5%
-1.4%
0.7%
-0.84%* -0.41%** -0.065% -1.1%*
0.13%
Note: While not all the coefficient estimates are reported, all the control variables are the same as those used in table 4.1, including year and county dummies. All regressions use weighted least squares, where the weighting is each county's population. The nondiscretionary-law-times-county-population variable that was used in the earlier regressions instead of the variable for change in right-to-carry permits was tried here and produced very similar results. I also tried controlling for either the robbery or burglary rates, but I obtained very similar results.
*The result is statistically significant at the 1 percent level for a two-tailed t-test. **The result is statistically significant at the 10 percent level for a two-tailed t-test.
Table 5.5 Crime and county data on concealed-handgun permits: Oregon data
Percent change in the crime rate
Crimes per 100,000 population
Murder
Rape
Aggravated assault
Auto Robbery theft
Burglary Larceny
Due to a 1 percent change -37%**** -6.7% -4.8%
in the number of right-to-carry pistol permits/ population over 21 between 1988 and each year since the law was implemented
Due to a 1 percent change -0.34%* -1%* -0.4%*
in the arrest rate for the crime category
Due to a 1 percent change -0.2%* -0.09%* -1.5%*
in the conviction rate for the crime category
-4.7%
12%
2.7%
-0.4%*
-0.19%*
-.04%
-0.37%*
-0.7%*
-0.9%*
-0.27%* -0.86%*
Note: While not all the coefficient estimates are reported, all the control variables are the same as those used in table 4.1, including year and county dummies. I also controlled for sentence length, but the different reporting practices used by Oregon over this period make its use somewhat problematic. To deal with this problem, the sentence-length variable was interacted with year-dummy variables. Thus, while the variable is not consistent over time, it is still valuable in distinguishing penalties across counties at a particular point in time. The categories for violent and property crimes are eliminated because the mean sentence-length data supplied by Oregon did not allow us to use these two categories. All regressions use weighted least squares, where the weighting is each county's population. *The result is statistically significant at the 1 percent level for a two-tailed t-test. **The result is statistically significant at the 5 percent level for a two-tailed t-test. ***The result is statistically significant at the 10 percent level for a two-tailed t-test. ****The result is statistically significant at the 11 percent level for a two-tailed t-test.
sions the effect is statistically significant. Five cases for Pennsylvania (violent crime, murder, aggravated assault, robbery, and burglary) show that arrest rates explain more than 15 percent of the change in crime rates. 8 Automobile theft is the only crime for which the arrest rate is insignificant in both tables.
For Pennsylvania, murder and rape are the only crimes for which per-capita concealed-handgun permits explain a greater percentage of the variation in crime rates than does the arrest rate. However, increased concealed-handgun licensing explains more than 10 percent of the variation in murder, rape, aggravated assault, and burglary rates. Violent crimes, with the exception of robbery, show that greater numbers of concealed-handgun permits lower violent crime rates, while property crimes exhibit very little relationship. The portion of the variation for property crimes that is explained by concealed-handgun licensing is only about one-tenth as large as the variation for violent crimes that is explained by such licensing, which is not too surprising, given the much more direct impact that concealed handguns have on violent crime. 9 The regressions for Oregon weakly imply a similar relationship between concealed-handgun use and crime, but the effect is only strongly statistically significant for larceny; it is weakly significant for murder.
The Oregon data also show that higher conviction rates consistently result in significantly lower crime rates. The change in conviction rates explains 4 to 20 percent of the change in the corresponding crime rates; 10 however, for five of the seven crime categories, increases in conviction rates appear to produce a smaller deterrent effect than increases in arrest rates. 11 The greatest differences between the deterrent effects of arrest and conviction rates produce an interesting pattern. For rape, increasing the arrest rate by 1 percent produces more than ten times the deterrent effect of increasing the conviction rate for those who have been arrested by 1 percent. For auto theft, arrest seems more important than conviction: a 1 percent increase in the arrest rate reduces crime by about ten times more than the same increase in convictions. These results are consistent with the assumption that arrests produce large penalties in terms of shame or negative reputation. 12 In fact, the existing evidence shows that the reputational penalties from arrest and conviction can dwarf the legally imposed penalties. 13 This is some of the first evidence that the reputational penalties from arrests alone provide significant deterrence for some crimes.
One possible explanation for these results is that Oregon simultaneously passed both the nondiscretionary concealed-handgun law and a waiting period. The statistics in table 4.11 suggest that the long waiting period imposed by the Oregon law (fifteen days) increased murder by 5
VICTIMS AND THE BENEFITS FROM P ROTECTI ON / 107
percent, rape by 2 percent, and robbery by 6 percent. At least in the case of murder, which is weakly statistically significant in any case, the estimates from tables 4.11 and 5.5 together indicate that if Oregon had not adopted its waiting period, the drop in murder resulting from the concealed-handgun law would have been statistically significant at the 5 percent level.
The results for sentence length are not shown, but the t-statistics are frequently near zero, and the coefficients indicate no clear pattern. One possible explanation for this result is that all the changes in sentencing rules produced a great deal of noise in this variable, not only over time but also across counties. For example, after 1989, whether a crime was prosecuted under the pre- or post-1989 rules depended on when the crime took place. If the average time between when the offense occurred and when the prosecution took place differed across counties, the recorded sentence length could vary even if the actual time served was the same.
Florida's state-level data showing the changes in crime rates and changes in the number of concealed-handgun permits are quite suggestive (see figure 5.2). Cuba's Mariel Boat Lift created a sudden upsurge in Florida's murder rate from 1980 through 1982. By 1983 the murder rate had return to its pre-Mariel level, and it remained relatively constant or exhibited a slight upward trend until the state adopted its nondiscretion-ary concealed-handgun law in 1987. Murder-rate data are not available for 1988 because of changes in the reporting process, but the available evidence indicates that the murder rate began to drop when the law was adopted, and the size of the drop corresponded with the number of concealed-handgun permits outstanding. Ironically, the first post-1987 upward movement in murder rates occurred in 1992, when Florida began to require a waiting period and background check before issuing permits.