Pro Puppet (39 page)
Authors: Jeffrey McCune James Turnbull

[master]
reports = http
reporturl = http://dashboard.example.com:80/reports
You then need to restart the Puppet master to update its configuration. Now, when Puppet clients connect, they will send a report to the URL you specified; Puppet Dashboard will receive and then process the report.
For versions 0.25.x and earlier, you need to use a report processor provided with the Dashboard product rather than the in-built HTTP report type (which is not available in these earlier releases). You first need to enable reporting on our Puppet clients by setting thereportoption in the[puppetd]section of thepuppet.conffile totrue.
[puppetd]
report = true
Then on the Puppet master, find the value of yourlibdir, the location of the Puppet libraries:
$ puppetmasterd --configprint libdir
By default this will be something like /var/lib/puppet/lib. Create a directory under this path:
$ sudo mkdir –p /var/lib/puppet/lib/puppet/reports
Then copy the Puppet report processor into this directory from your Dashboard installation.
$ sudo cp /usr/share/puppet-dashboard/ext/puppet/puppet_dashboard.rb
 /var/lib/puppet/lib/reports
This special report processor assumes that your Dashboard instance is on the local host at port 3000. If this is not the case, you can edit thepuppet_dashboard.rbfile to change the target of the report. Change the following options at the top of the file:
HOST = 'localhost'
PORT = 3000
Update yourpuppet.conffile on the Puppet master in the[puppetmasterd]section:
[puppetmasterd]
reports = puppet_dashboard
And lastly, restart the Puppet master daemon.
Now that you've got Puppet adding its reports to the Dashboard, you can examine them and view the results. Click on a particular node to see details of its recent configuration runs, and you should see a screen similar to
Figure 7-3
.
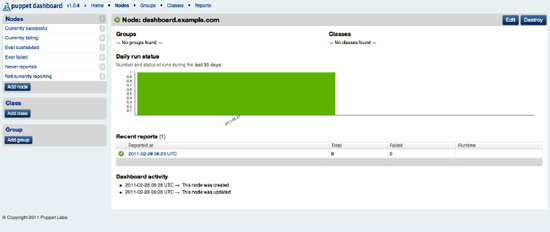
Figure 7-3.
The node detail screen
The screen shows a list of recent runs, the total resources applied, any resources that failed, and the total runtime of the run in seconds.
Drilling down into an individual run will show log output, specifically that related to any failed resources. Also more resource metrics and timings on individual resource types will be displayed. You can see an example of this screen in
Figure 7-4
.
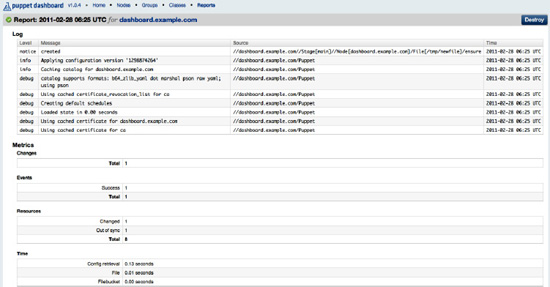
Figure 7-4.
A Puppet configuration run
In addition to its ability to display reports and data, the Dashboard can also act as an external classifier. We discussed external node classification (ENC) and why it's useful to simplify and organize large number of nodes in
Chapter 5
. This can become even easier with a web interface like the Dashboard that configures these nodes, classes and parameters.
To enable the Dashboard's external node classification capability, you need to configure Puppet to use an ENC. On Puppet 2.6.x and later, this means adding an ENC to your master'spuppet.confconfiguration file:
[master]
node_terminus = exec
external_nodes = /usr/share/puppet-dashboard/bin/external_node
 Note
Note
On Puppet 0.25.x and earlier versions, this section is called[puppetmasterd]rather than[master].
The external_node ENC assumes that your Dashboard is located on the local host at port 3000. If this isn't the case, you can edit it to suit your environment. Open this file and find the line:
DASHBOARD_URL="http://dashboard:3000"
Modify the line to reflect where your Dashboard is located. You will then need to restart the Puppet master to update your ENC configuration. Or, if you don't want to edit the file, you can specify a local environment variable on the Puppet master,PUPPET_DASHBOARD_URL, that contains this information.
Inside the Dashboard you can now create three kinds of configuration: nodes, classes and groups. A node is the normal Puppet node and contains the node's hostname and a description of the node. Remember that the node's hostname needs to match the real node so that when Puppet queries the Dashboard, the right host is returned. You can also add any parameters (which are the same as Puppet variables) and any classes or groups that the node is assigned to. You can see the Add Node page in
Figure 7-5
.
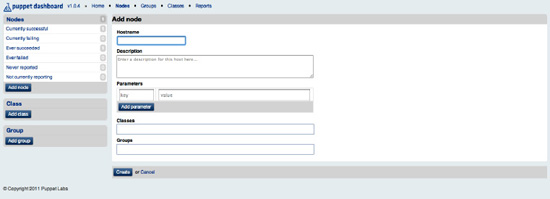
Figure 7-5.
Adding a node
You can also create one or more classes that can be assigned to nodes or groups by clicking the Add Class link. These are simply class names – this doesn't directly create a Puppet class, it just lists those classes that should be applied to a particular node. You will still need to write the required Puppet manifests on your master.
Lastly, you can create Groups as you can see in
Figure 7-6
.
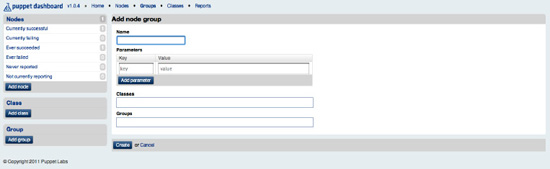
Figure 7-6.
Adding Groups
Groups don't directly have a representation in Puppet manifests, but are rather a way of grouping your nodes on the Dashboard itself. Once you've created a Group (in which you can also add parameters and additional classes, which will be cumulatively applied to any node that is a member of the Group), you can then add nodes to it. Clicking on the newly created group in the left hand will display a screen showing all of the nodes assigned to that Group, as you can see in
Figure 7-7
.
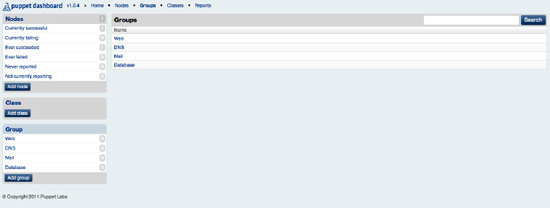
Figure 7-7.
The Group summary screen
Note
You can add classes, parameters and groups to existing nodes by clicking on the node and then on the Edit button. You can also delete nodes, classes and groups by clicking on the dramatically-named Destroy button.
With your node configuration in place on the Dashboard, when the Puppet master runs and uses the external node classifier to query for node data it will contact the Dashboard. The Dashboard's API will return the required data, class and parameter information to populate the required node.