The 80/20 Principle: The Secret of Achieving More With Less (12 page)
Read The 80/20 Principle: The Secret of Achieving More With Less Online
Authors: Richard Koch
Tags: #Non-Fiction, #Psychology, #Self Help, #Business, #Philosophy

Figure 24 Electronic Instruments Inc. table of profitability by segment
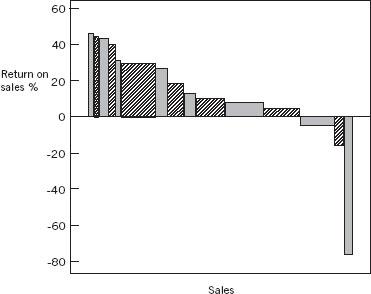
Figure 25 Electronic Instruments Inc. chart of possibility by segment
To highlight the imbalance between the split of revenues and profits, we can again construct either an 80/20 Table (Figure 26) or an 80/20 Chart (Figure 27).
We can see from these figures that the top six segments comprise only 26.3 percent of total sales, but 82.9 percent of profits: so here we have an 83/26 rule.
What did Electronic Instruments do to boost profits?
Figures 26 and 27 focused attention on three types of business.
The most profitable quarter of the business, segments 1–6, was classified initially as top priority A businesses, to be grown most aggressively. More than 80 percent of profits came from these segments, yet they were receiving only an average amount of management time in line with their turnover. A decision was made to raise the amount of time spent on these businesses to two-thirds of the total. The sales force focused on trying to sell more of these products, both to existing customers and to new ones. It was realized that the group could afford to offer extra services or to cut prices slightly and still enjoy very good returns.
Percentage of sales | Percentage of profits | |||
Segment | Type | Cumulative | Type | Cumulative |
1 | 1.9 | 1.9 | 7.7 | 7.7 |
2 | 2.5 | 4.4 | 9.8 | 17.5 |
3 | 4.5 | 8.9 | 17.2 | 34.7 |
4 | 1.7 | 10.6 | 6.0 | 40.7 |
5 | 1.5 | 12.1 | 4.0 | 44.7 |
6 | 14.2 | 26.3 | 38.2 | 82.9 |
7 | 2.5 | 28.8 | 4.6 | 87.5 |
8 | 6.6 | 35.4 | 10.0 | 97.5 |
9 | 3.5 | 38.9 | 4.1 | 101.6 |
10 | 10.9 | 49.8 | 9.7 | 111.3 |
11 | 18.3 | 68.1 | 14.4 | 125.7 |
12 | 15.2 | 83.3 | 5.8 | 131.5 |
13 | 9.1 | 92.4 | -2.7 | 128.8 |
14 | 4.2 | 96.6 | -6.0 | 122.6 |
15 | 3.4 | 100.0 | -22.6 | 100.0 |
Figure 26 Electronic Instruments Inc. 80/20 Table of sales and profits by segment
The second set of businesses comprised segments 7–12. In total these made up 57 percent of total sales and 49 percent of total profits, in other words, on average, slightly below-average profitability. These segments were classified as B priority, although clearly some segments in this category (such as 7 and 8) were more interesting than others (such as 11 and 12). The priority to be accorded to these segments also depended on the answers to the two questions posed at the start of the chapter, that is, on whether each segment was a good market to be in and on how well the company was positioned in each segment. The answers to these questions are described in the final part of this chapter.
At this stage, a decision was made to cut the amount of management time spent on the B segments from around 60 percent to about half this level. Prices on some of the less profitable segments were also raised.
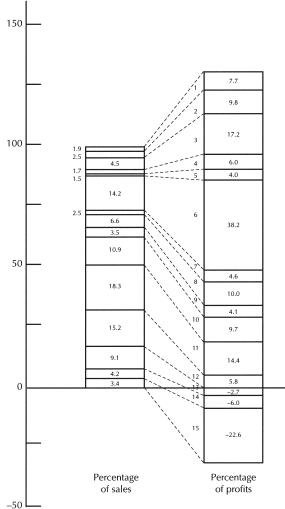
Figure 27 Electronic Instruments Inc. 80/20 Chart of profitability by segment
The third category, designated X priority, comprised the loss-making segments 13–15. A decision on what to do about these segments was deferred, as for the B category, until after analysis of market attractiveness and the strength of the company’s position in each market.
Provisionally, however, it was possible to reset priorities as laid out in Figure 28.
Priority | Segments of sales | Percentage of profits | Percentage | Actions |
A | 1–6 | 26.3 | 82.9 | Raise sales effort Raise management time Flexibility on price |
B | 7–12 | 57.0 | 48.5 | Lower management time Lower sales effort Raise some prices |
X | 13–15 | 16.7 | (31.4) | Review viability |
Total | 100.0 | 100.0 |
Figure 28 Electronic Instruments Inc. result of 80/20 Analysis
Before reaching final decisions on any segment, however, the instrumentation group’s top management examined the two other questions, besides profitability, that are key to strategy:
• Is the segment an attractive market to be in?
• How well is the firm positioned in each segment?
Figure 29 shows the final strategy conclusions for Electronic Instruments Inc.
Segment | Market attractive? | Firm well positioned? | Profitability |
1 | Yes | Yes | Very high |
2 | Yes | Yes | Very high |
3 | Yes | Yes | Very high |
4 | Yes | Yes | Very high |
5 | Yes | Yes | High |
6 | Yes | Yes | High |
7 | Yes | Moderately | High |
8 | Yes | Moderately | Fairly high |
9 | Yes | No | OK |
10 | Not very | Yes | OK |
11 | Not very | Yes | OK |
12 | No | Moderately | Poor |
13 | Yes | Improving | Loss making |
14 | No | Moderately | Loss making |
15 | No | No | Loss making |
Figure 29 Electronic Instruments Inc. strategic diagnosis
What actions followed this diagnosis?
All of the A profit segments were also attractive markets—they were growing, had high barriers to entry for new competitors, had more demand than capacity, faced no threat from competing technologies, and had high bargaining power vis-à-vis both customers and component suppliers. As a result, nearly all the competitors in these markets made good money.
My client was also well positioned in each segment, meaning that it had a high market share and was one of the top three suppliers. Its technology was above average and its cost position better than average (that is, lower cost) compared to its competitors.
Since these were also the most profitable segments, the analysis confirmed the implications of the 80/20 profit comparison. Segments 1–6 therefore remained A segments and effort was concentrated on keeping all existing business and gaining market share in these segments by increasing sales to current customers and converting new ones.
The strategy could now be refined for some of the other segments in the B category. Segment 9 was interesting. Profitability was moderate, but this was not because the market was unattractive; on the contrary, it was highly attractive, with most of the other players making very good profits. But my client had a low market share and a high-cost position in this segment, largely because they were using old technology.
To update the technology would have taken a terrific effort and would have been very expensive. A decision was made, therefore, to “harvest” the segment, which meant cutting the effort going to protect the business and raising prices. This was expected to lead to a loss in sales but, for a time, to higher profits. In fact, cutting the effort and raising prices did raise margins, but led to very little loss of sales in the short term. It turned out that the customers were mainly locked in to the old technology themselves and had little choice of alternative suppliers until they switched over to the new technology. For my client profitability rose from 12.9 percent to over 20 percent, although it was recognized that this might be a temporary development.