The Information (36 page)

To illustrate the differences between these different orders of structure, he wrote down—computed, really—a series of “approximations” of English text. He used an alphabet of twenty-seven characters, the letters plus a space between words, and generated strings of characters with the help of a table of random numbers. (These he drew from a book newly published for such purposes by Cambridge University Press: 100,000 digits for three shillings nine pence, and the authors “have furnished a guarantee of the random arrangement.”
♦
) Even with random numbers presupplied, working out the sequences was painstaking. The sample texts looked like this:
- “Zero-order approximation”—that is, random characters, no structure or correlations.
XFOML RXKHRJFFJUJ ZLPWCFWKCYJ
FFJEYVKCQSGHYD GPAAMKBZAACIBZLHJGD
.
- First order—each character is independent of the rest, but the frequencies are those expected in English: more
e
’s and
t
’s, fewer
z
’s and
j
’s, and the word lengths look realistic.
OCRO HLI RGWR NIMILWIS EU LL NBNESEBYA
TH EEI ALHENHTTPA OOBTTVA NAH BRL.
- Second order—the frequencies of each character match English and so also do the frequencies of each digram, or letter pair. (Shannon found
the necessary statistics in tables constructed for use by code breakers.
♦
The most common digram in English is
th
, with a frequency of 168 per thousand words, followed by
he, an, re
, and
er
. Quite a few digrams have zero frequency.)
ON IE ANTSOUTINYS ARE T INCTORE ST BE S DEAMY ACHIN
D ILONASIVE TUCOOWE AT TEASONARE FUSO TIZIN ANDY
TOBESEACE CTISBE.
- Third order—trigram structure.
IN NO IST LAT WHEY CRATICT FROURE BIRS GROCID
PONDENOME OF DEMONSTURES OF THE REPTAGIN IS
REGOACTIONA OF CRE.
- First-order word approximation.
REPRESENTING AND SPEEDILY IS AN GOOD APT OR COME CAN
DIFFERENT NATURAL HERE HE THE A IN CAME THE TO
OF TO EXPERT GRAY COME TO FURNISHES THE LINE MESSAGE HAD
BE THESE.
- Second-order word approximation—now pairs of words appear in the expected frequency, so we do not see “a in” or “to of.”
THE HEAD AND IN FRONTAL ATTACK ON AN ENGLISH
WRITER THAT THE CHARACTER OF THIS POINT IS
THEREFORE ANOTHER METHOD FOR THE LETTERS THAT
THE TIME OF WHO EVER TOLD THE PROBLEM FOR AN
UNEXPECTED
.
These sequences increasingly “look” like English. Less subjectively, it turns out that touch typists can handle them with increasing speed—another indication of the ways people unconsciously internalize a language’s statistical structure.
Shannon could have produced further approximations, given enough time, but the labor involved was becoming enormous. The point was to represent a message as the outcome of a process that generated events with discrete probabilities. Then what could be said about the amount of information, or the rate at which information is generated? For each event, the possible choices each have a known probability (represented as
p
1
,
p
2
,
p
3
, and so on). Shannon wanted to define the measure of information (represented as
H
) as the measure of uncertainty: “of how much ‘choice’ is involved in the selection of the event or of how uncertain we are of the outcome.”
♦
The probabilities might be the same or different, but generally more choices meant more uncertainty—more information. Choices might be broken down into successive choices, with their own probabilities, and the probabilities had to be additive; for example, the probability of a particular digram should be a weighted sum of the probabilities of the individual symbols. When those probabilities were equal, the amount of information conveyed by each symbol was simply the logarithm of the number of possible symbols—Nyquist and Hartley’s formula:
H = n
log
s
For the more realistic case, Shannon reached an elegant solution to the problem of how to measure information as a function of probabilities—an equation that summed the probabilities with a logarithmic weighting (base 2 was most convenient). It is the average logarithm of the improbability of the message; in effect, a measure of unexpectedness:
H =
−Σ
p
i
log
2
p
i
where
p
i
is the probability of each message. He declared that we would be seeing this again and again: that quantities of this form “play a central role in information theory as measures of information, choice, and
uncertainty.” Indeed,
H
is ubiquitous, conventionally called the entropy of a message, or the Shannon entropy, or, simply, the information.
A new unit of measure was needed. Shannon said: “The resulting units may be called binary digits, or more briefly,
bits
.”
♦
As the smallest possible quantity of information, a bit represents the amount of uncertainty that exists in the flipping of a coin. The coin toss makes a choice between two possibilities of equal likelihood: in this case
p
1
and
p
2
each equal ½; the base 2 logarithm of ½ is −1; so
H
= 1 bit. A single character chosen randomly from an alphabet of 32 conveys more information: 5 bits, to be exact, because there are 32 possible messages and the logarithm of 32 is 5. A string of 1,000 such characters carries 5,000 bits—not just by simple multiplication, but because the amount of information represents the amount of uncertainty: the number of possible choices. With 1,000 characters in a 32-character alphabet, there are 32
1000
possible messages, and the logarithm of that number is 5,000.
This is where the statistical structure of natural languages reenters the picture. If the thousand-character message is known to be English text, the number of possible messages is smaller—
much
smaller. Looking at correlations extending over eight letters, Shannon estimated that English has a built-in redundancy of about 50 percent: that each new character of a message conveys not 5 bits but only about 2.3. Considering longer-range statistical effects, at the level of sentences and paragraphs, he raised that estimate to 75 percent—warning, however, that such estimates become “more erratic and uncertain, and they depend more critically on the type of text involved.”
♦
One way to measure redundancy was crudely empirical: carry out a psychology test with a human subject. This method “exploits the fact that anyone speaking a language possesses, implicitly, an enormous knowledge of the statistics of the language.”
Familiarity with the words, idioms, clichés and grammar enables him to fill in missing or incorrect letters in proof-reading, or to complete an unfinished phrase in conversation.
He might have said “her,” because in point of fact his test subject was his wife, Betty. He pulled a book from the shelf (it was a Raymond Chandler detective novel,
Pickup on Noon Street
), put his finger on a short passage at random, and asked Betty to start guessing the letter, then the next letter, then the next. The more text she saw, of course, the better her chances of guessing right. After “
A SMALL OBLONG READING LAMP ON THE
” she got the next letter wrong. But once she knew it was
D
,
she had no trouble guessing the next three letters. Shannon observed, “The errors, as would be expected, occur most frequently at the beginning of words and syllables where the line of thought has more possibility of branching out.”
Quantifying predictability and redundancy in this way is a backward way of measuring information content. If a letter can be guessed from what comes before, it is redundant; to the extent that it is redundant, it provides no new information. If English is 75 percent redundant, then a thousand-letter message in English carries only 25 percent as much information as one thousand letters chosen at random. Paradoxical though it sounded, random messages carry
more
information. The implication was that natural-language text could be encoded more efficiently for transmission or storage.
Shannon demonstrated one way to do this, an algorithm that exploits differing probabilities of different symbols. And he delivered a stunning package of fundamental results. One was a formula for channel capacity, the absolute speed limit of any communication channel (now known simply as the Shannon limit). Another was the discovery that, within that limit, it must always be possible to devise schemes of error correction that will overcome any level of noise. The sender may have to devote more and more bits to correcting errors, making transmission slower and slower, but the message will ultimately get through. Shannon did not show how to design such schemes; he only proved that it was possible, thereby inspiring a future branch of computer science. “To make the chance of error as small as you wish? Nobody had thought of that,” his colleague Robert Fano recalled years later. “How he got that insight, how he came to believe such a thing, I don’t know. But almost all
modern communication theory is based on that work.”
♦
Whether removing redundancy to increase efficiency or adding redundancy to enable error correction, the encoding depends on knowledge of the language’s statistical structure to do the encoding. Information cannot be separated from probabilities. A bit, fundamentally, is always a coin toss.
If the two sides of a coin were one way of representing a bit, Shannon offered a more practical hardware example as well:
A device with two stable positions, such as a relay or a flip-flop circuit, can store one bit of information.
N
such devices can store
N
bits, since the total number of possible states is 2
N
and log
2
2
N
=
N
.
Shannon had seen devices—arrays of relays, for example—that could store hundreds, even thousands of bits. That seemed like a great many. As he was finishing his write-up, he wandered one day into the office of a Bell Labs colleague, William Shockley, an Englishman in his thirties. Shockley belonged to a group of solid-state physicists working on alternatives to vacuum tubes for electronics, and sitting on his desk was a tiny prototype, a piece of semiconducting crystal. “It’s a solid-state amplifier,” Shockley told Shannon.
♦
At that point it still needed a name.
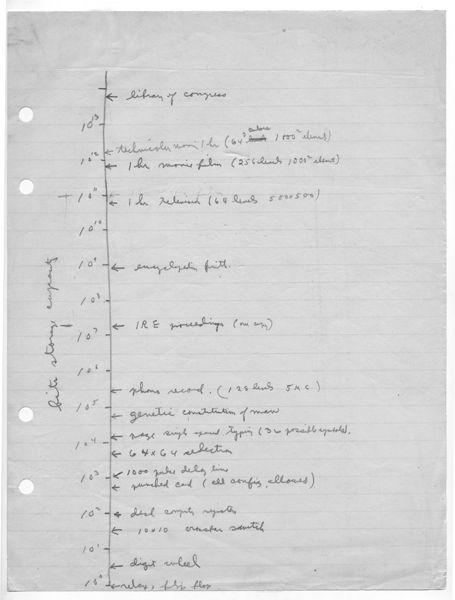
One day in the summer of 1949, before the book version of
The Mathematical Theory of Communication
appeared, Shannon took a pencil and a piece of notebook paper, drew a line from top to bottom, and wrote the powers of ten from 10
0
to 10
13
. He labeled this axis “bits storage capacity.”
♦
He began listing some items that might be said to “store” information. A digit wheel, of the kind used in a desktop adding machine—ten decimal digits—represents just over 3 bits. At just under 10
3
bits, he wrote “punched card (all config. allowed).” At 10
4
he put “page single spaced typing (32 possible symbols).” Near 10
5
he wrote something offbeat: “genetic constitution of man.” There was no real precedent for this in current scientific thinking. James D. Watson was a twenty-one-year-old
student of zoology in Indiana; the discovery of the structure of DNA lay several years in the future. This was the first time anyone suggested the genome was an information store measurable in bits. Shannon’s guess was conservative, by at least four orders of magnitude. He thought a “phono record (128 levels)” held more information: about 300,000 bits. To the 10 million level he assigned a thick professional journal (
Proceedings of the Institute of Radio Engineers
) and to 1 billion the
Encyclopaedia Britannica
. He estimated one hour of broadcast television at 10
11
bits and one hour of “technicolor movie” at more than a trillion. Finally, just under his pencil mark for 10
14
, 100 trillion bits, he put the largest information stockpile he could think of: the Library of Congress.