UFOs in Reality (42 page)
Authors: T.R. Dutton

App. Fig 1
The sphere of the sky (Celestial Sphere) represented in this way is divided up into equivalents of latitude and longitude and they are called, respectively, ‘Declination’ and ‘Right Ascension’.
The concentric circles shown in each diagram pass through the stars directly above those same latitudes on the Earth’s surface below them
. As drawn, these circles are at 15º (latitude/declination) intervals – and other latitudes/declinations can be found by interpolation between them. Right Ascension (R.A.) differs from longitude in that the 15º divisions shown are fixed in the sky, the zero datum being determined by the position of the Sun among the stars at noon on the Spring Equinox. During the course of a day, the Earth rotates once beneath this fixed framework, which also locates the positions of the fixed stars. Each 15º division of R.A. represents (approximately) 1 hour of rotation of the Earth beneath the stars and, therefore,
R.A. is, by tradition, progressively measured in hours (of sidereal time) to the East of the zero datum
. Unlike the planets of the solar system, the stars are so far away that they appear to be fixed – which means they can be regarded as fixed reference points in space, relative to which the Sun and other solar system bodies are observed to move, in an orderly and predictable manner.
These features together provide useful navigational aids for mariners, aviators and astronauts. The Astronautical Theory suggests that even the ETIs use them for that purpose.
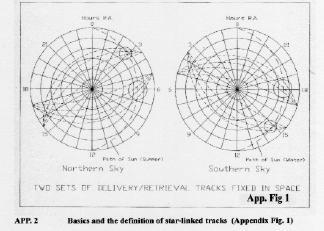
App. Fig.1
superimposes onto the starfield background those
fixed
identified approach and departure tracks in space, which seem to be used by ETI probes engaged in routine monitoring and exploration of Earth. When these tracks were first identified, most of the events relating to them had occurred north of the equator, so it was convenient to label them with the R.A. of the meridian (radial line) which corresponded to
the northern-most
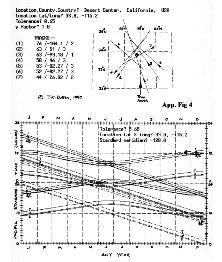
point on each track of a set. Each set consisted of 10 well-defined ‘hoops’ round the world, the planes of which were found to be inclined to the equatorial plane at angles of 42, 43, 44, 52, 53, 54, 58, 63, 67 and 76 degrees. Only four of these options are drawn, and they represent the range of all ten in each set. As can be seen from the diagram of the northern sky, one set is linked to the 11:00 hr. R.A. meridian and the other, to that corresponding to 21:30 hr. R.A.
Because the Earth is tilted at a fixed angle to its path round the Sun, the Sun appears to follow a path among the stars which is similarly inclined to the Celestial Equator – and its path across the sky during the northern summer and winter periods is shown as a dashed arc to the right of each diagram. Clearly, the planes of the star-orientated tracks (hoops) intersect the plane of the path of the Sun (the Ecliptic Plane) in well-defined areas of the sky. Since a range of angles appear to have been used, the actual intersections are spread throughout those limited zones, as shown.
However, as will be explained later, the 53º track intersections seem to be of particular significance.
As explained in the main report, the indicators that ETI activity stemmed from locations in the solar system – and that alignments of certain bodies with the identified star-related track lines had already been noted on several occasions previously – meant that a search for such bodies within the indicated ‘capture’ zones might be revealing. A positive result would be indicated if were to be found that such alignments existed, given the orientation of a track identified, by the date and timing of an event, to be in accordance with the programming of the Theory.
APP. 3 Definition of Terminator-linked tracks
The terminator-linked track sets
were found to have the same number (10) optional track angles as the fixed, star-linked, tracks – and were arranged similarly, on either side of the poles – but they moved round the sky in a manner related to the movement of the Sun.
App. Fig. 2
illustrates this for two example dates of the year.

App. Fig 2
To understand these diagrams, it is important to be orientated correctly.
Remembering that the framework in the sky is very much linked to the latitude/longitude framework on the Earth’s surface and, particularly,
that the circles of constant Declination are in the sky directly above the Earth’s Latitude circles
, we can effectively project the arc of the Earth’s terminator into the sky in a similar way – as shown in these diagrams.
During the evolution of the Theory it was found that tracks with this kind of orientation were most frequently inclined with 52º, 53º and 54º angles. These terminator-linked tracks were found to be
celestially-orientated
(despite being linked to the Sun’s position) and
the celestial meridian corresponding to the point on the terminator at 53º north latitude seemed to fix the orientation of all other tracks in the set of ten, on every occasion
.
App.Fig. 2
shows the Sun located at two dates of the year, one being in late Spring and the other in late Autumn. Only three tracks are drawn to represent each set of 10, the middle one of each set being inclined at 53º. This track has been located so that its most northerly point (and most southerly one) coincides with the terminator. A radial meridian has then been drawn through each of the northern intersections (A or B) and this has determined the orientation, in the sky, of the tracks with other inclinations. Each track set has been identified as being linked to either the sunrise (sr) or sunset (ss) – and to understand why it has been identified as being such, it is necessary to imagine that one is looking upwards from the centre of a transparent Earth, towards the north, in the left-hand diagram. However, the actual track labels have been reversed in the southern hemisphere, because
the sunrise and sunset labels always refer to the northern situation
, as they did for the fixed star-linked tracks. (In other words, an inclined ‘hoop’ linked to northern sunrise is also linked to southern sunset – and vice-versa – but
its northern link always determines its label.
) This diagram indicates how the R.A. range of the respective ecliptic intersection zones can vary with the position of the Sun during its annual movement round the sky – something which needs to be borne in mind when the results of this exercise are being considered.
APP. 4 The ‘Stargate’ periods.
By comparison of App. Figs. 1 and 2
it becomes clear that the Terminator track sets and the star-linked sets can become superimposed at four periods of each year. Small variations in the motions of the bodies of the solar system cause small annual variations in these periods to occur, which are not accounted for by the simplified model adopted for the Astronautical Theory.
The theoretical model predicts that the
11:00 hr. R.A. track set
coincides with the
sunrise set
on
15th November
each year; and with the
sunset set
on
15th May.
Similar dates for the
21:30 hr. R.A. set
are
15th June
and
15th December
, respectively. (However, it should be remembered that the actual dates when these coincidences occur could vary by several days on either side of the nominal dates.)
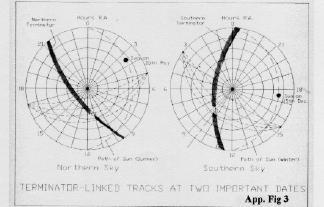
App. Fig 3
To demonstrate this feature of the model,
App.Fig. 3
shows the coincidence of the sunset track set and the 11:00 hr. R.A. set on 15th May, in the left-hand diagram, and a similar coincidence of the sunset track set and the 21:30 hr. R.A. set on 15th December, in the right-hand diagram. These date periods of coincidence (taking account of the expected scatter of days from the nominal dates) may have some special significance, because they have been associated with 4 of the 28 CE3/CE4 cases considered in this exercise. Further evidence for this suspicion was provided, unwittingly, by a British ‘contactee’( Mr. J. Glanville), who was unaware of this feature of the model. During 1997 and 1998, he informed me, progressively, whenever he had received prior information that he would be contacted. Some of the given dates were in those special track-alignment periods. Mr. Glanville informed me that a sci-fi associate had labelled them
‘stargate’
dates. All the Glanville dates and times were in accordance with the predictions of the Theory for the locations specified – and, almost invariably, the expected activity actually did occur, as forecast, on each occasion.
APP. 5 The CE3/CE4 Alignments Study
It is important to stress that the CE3 and CE4 reports now included in the Correlated Tracks Database listing – like all other cases in that computed database – were not included in the manually-processed database used to establish the Astronautical Theory.
They have been included in the current database after having been processed and found to correlate with the theoretical predictions.
The first case considered is the very controversial Adamski encounter of 20th November, 1952. Despite the rather incredible story which developed from this event, the date and timing details given by George Adamski were in perfect agreement with theoretical predictions for that place, date and time.