Understanding Sabermetrics (21 page)
Read Understanding Sabermetrics Online
Authors: Gabriel B. Costa,Michael R. Huber,John T. Saccoma

For pitching win shares, the marginal-runs concept once again comes into play. In 1901, six men threw pitches for the Phillies, and their numbers are in Table 9.8.
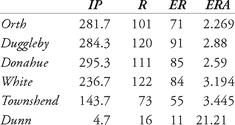
Table 9.8 Pitching data for the 1901 Phillies
They let up a total of 543 runs, 397 of them earned, or 146 unearned runs. Thus, while the 1901 Phillies pitched to a 2.87 ERA, they gave up a total of 3.88 runs per game. In fact, this provides evidence that the Phillies were an above-average defensive team; the National league in 1901 scored 5194 runs, 3678 earned, for an average of 189.5 unearned runs per team, or more than fifty more unearned runs than the Phillies allowed.
By comparison, the 2001 edition of the Phillies had 22 men pitch, giving up 667 earned runs. The game certainly changed over the course of the century.
To calculate a team’s pitching win shares, the league ERA is multiplied by 1.50, and then 1 is subtracted from this result. Then the number of earned runs the pitcher would have allowed had this been his ERA is computed. For example, Al Orth had an ERA of 2.27, computed by multiplying earned runs (71) by 9 and dividing by the number of innings pitched (281⅔). The league ERA was 3.32; 1.5 × 3.32 - 1 = 3.98. To compute the number of earned runs Orth would have surrendered with this ERA, we take the standard ERA formula and solved for Earned Runs, i.e., ER = IP × ERA / 9. Thus, he would have given up (281⅔) × 3.98 / 9 = 124.6 projected ER. This total is then decreased by the actual number of earned runs allowed, so 124.6 - 71 = 53.6. Then his number of saves is added to this quantity, and then the total is divided by three. He had one save, so we have 54.6 / 3 = 18.2, or 18.2 win shares for Al Orth.
We note that Orth started 33 games in 1901, completed 30 of them, and had 20 wins, with an ERA more than a point below the league average. Roughly 18 win shares seems low for him; we will need to rectify this. But first, Table 9.9 gives the pitching win shares totals for the 1901 Phillies.

Table 9.9 Data for calculating pitching win shares, 1901 Phillies (*league ERA
×
1.5 - 1)
×
1.5 - 1)
Note that Jack Dunn’s pitching win-shares total is actually -3; James treats any negative win shares as zero, although the folks at
Hardballtimes.com
allow for negative win shares.
Hardballtimes.com
allow for negative win shares.
Now, by James’ formulation, pitching win shares should be 35 percent of the team’s total, and 35 percent of 249 is about 87. The total pitching win shares is 55; this is about 63 percent of what the total should be. We adjust each pitcher’s total upward by 37 percent. This adjustment still leaves the pitching win shares about 11 too low. So, recalling that the park factor favors hitters by 2 percent, we added 2 points to the total of each of the top five pitchers, after rounding off. This means that 85 of the 1901 Phillies win shares are assigned to pitching. James himself assigned 96, or approximately 38.5 percent.
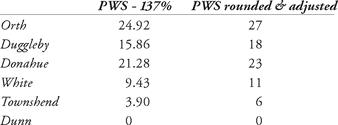
Table 9.10 Pitching win shares, 1901 Phillies, adjusted and rounded
In the short-form method, calculating fielding win shares disregards defense by pitchers. Thus, we have win-shares totals for all the pitchers on the 1901 Phillies:
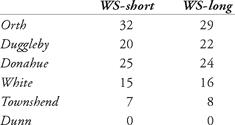

Table 9.11 Comparison of long- and short-form pitching win shares, 1901 Phillies
Note that the short form and long form totals are very similar.
James feels that his win-shares computation marks a breakthrough in valuation of players’ defensive statistics. Among the factors and considerations that go into this analysis are the following:
1. Strikeouts are removed from catchers’ fielding percentages;
2. First basemens’ throwing arms can be evaluating by estimating the number of assists that are not simply 3-1 flips to the pitcher covering;
3. Ground balls by a team can be estimated;
4. Team double plays need to be adjusted for ground ball tendency and opponents’ runners on base;
5. Putouts by third basemen do not indicate a particular skill level;
6. A bad team will have more outfielder and catcher assists than a good team.
Unfortunately, the short-form method takes none of these into account. Here is how to determine fielding win shares for position players:
• Catchers get 1 WS for every 24 G
• 1Bmen get 1 WS for every 76 G
• 2Bmen get 1 WS for every 28 G
• 3Bmen get 1 WS for every 38 G
• SS get 1 WS for every 25 G
• OFers get 1 WS for every 48 G
Here is the calculation for the 1901 Phillies:
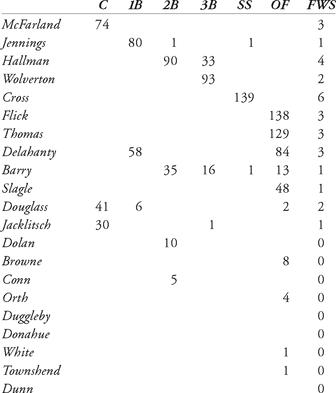

Table 9.12 Fielding win shares, 1901 Phillies
Each total is rounded off. This totals 30 fielding win shares for the entire team; using James’ guideline of 17 percent for fielding means that roughly 42 win shares (17 percent of 249) need to be assigned for fielding contributions. The total of 30 means that we are about 71 percent of where we need the figures to be; if we increase each total by 29 percent, and round off, we will have assigned about 39 Fielding Win Shares. If we assign each of the 5 pitchers who pitched a significant amount of time one fielding win share each for defensive contributions, after rounding-off we will have assigned 44 fielding win shares. James himself assigned 45 win shares for fielding. Our total is in shown here:


Table 9.13 Fielding win shares, 1901 Phillies, rounded and adjusted
An individual player’s win-shares total is computed by adding his pitching, batting and fielding win shares. This yields the entries here:


Table 9.14 Win-shares totals, 1901 Phillies
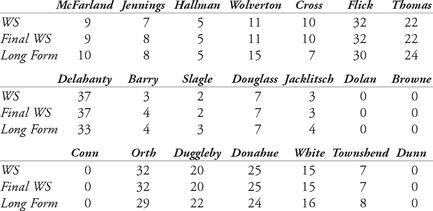
This totals 247, which is 2 short of 249. Looking at the un-rounded totals, it seems that Hughie Jennings and Shad Barry may have each deserved an extra win share, so they are awarded them. The last row of Table 9.15 shows the totals James obtained using the long-form method (the actual amount).
Other books
Cold Hearted (Cold Justice Book 6) by Toni Anderson
Before Tomorrowland by Jeff Jensen
An Air That Kills by Margaret Millar
Time Stood Still by London Miller
A Thousand Splendid Suns by Khaled Hosseini
Moonlight Surrender (Moonlight Book 3) by Ferrarella, Marie
The Amorous Nightingale by Edward Marston
Allies by Sharon Lee and Steve Miller, Steve Miller
Breve historia de la Argentina by José Luis Romero