Data Mining (95 page)
Authors: Mehmed Kantardzic

11.8 REVIEW QUESTIONS AND PROBLEMS
1.
Give specific examples of where Web-content mining, Web-structure mining, and Web-usage mining would be valuable. Discuss the benefits.
2.
Given a table of linked Web pages:
| Page | Linked to page |
| A | B, D, E, F |
| B | C, D, E |
| C | B, E, F |
| D | A, F, E |
| E | B, C, F |
| F | A, B |
(a)
Find authorities using two iterations of the HITS algorithm.
(b)
Find hubs using two iterations of the HITS algorithm.
(c)
Find the PageRank scores for each page after one iteration using 0.1 as the dampening factor.
(d)
Explain the HITS and PageRank authority rankings obtained in (a) and (c).
3.
For the traversal log: {X, Y, Z, W, Y, A, B, C, D, Y, C, D, E, F, D, E, X, Y, A, B, M, N},
(a)
find MFR;
(b)
find LRS if the threshold value is 0.3 (or 30%);
(c)
Find MRS.
4.
Given the following text documents and assumed decomposition:
| Document | Text |
| A | Web-content mining |
| B | Web-structure mining |
| C | Web-usage mining |
| D | Text mining |
(a)
create matrix A by using term counts from the original documents;
(b)
obtain rank 1, 2, and 3 approximations to the document representations;
(c)
calculate the variability preserved by rank 1, 2, and 3 approximations;
(d)
Manually cluster documents A, B, C, and D into two clusters.
5.
Given a table of linked Web pages and a dampening factor of 0.15:
| Page | Linked to page |
| A | F |
| B | F |
| C | F |
| D | F |
| E | A, F |
| F | E |
(a)
find the PageRank scores for each page after one iteration;
(b)
find the PageRank scores after 100 iterations, recording the absolute difference between scores per iteration (be sure to use some programming or scripting language to obtain these scores);
(c)
explain the scores and rankings computed previously in parts (a) and (b). How quickly would you say that the scores converged? Explain.
6.
Why is the text-refining task very important in a text-mining process? What are the results of text refining?
7.
Implement the HITS algorithm and discover authorities and hubs if the input is the table of linked pages.
8.
Implement the PageRank algorithm and discover central nodes in a table of linked pages.
9.
Develop a software tool for discovering maximal reference sequences in a Web-log file.
10.
Search the Web to find the basic characteristics of publicly available or commercial software tools for association-rule discovery. Document the results of your search.
11.
Apply LSA to 20 Web pages of your choosing and compare the clusters obtained using the original term counts as attributes against the attributes derived using LSA. Comment on the successes and shortcomings of this approach.
12.
What are the two main steps in mining
traversal patterns
using log data?
13.
The XYZ Corporation maintains a set of five Web pages: {A, B, C, D, and E}. The following sessions (listed in timestamp order) have been created:

Suppose that support threshold is 30%. Find all
large sequences
(after building the tree).
14.
Suppose a Web graph is undirected, that is, page i points to page j if and only page j points to page i. Are the following statements true or false? Justify your answers briefly.
(a)
The hubbiness and authority vectors are identical, that is, for each page, its hubbiness is equal to its authority.
(b)
The matrix M that we use to compute PageRank is symmetric, that is, M[i; j] = M[j; i] for all i and j.
11.9 REFERENCES FOR FURTHER STUDY
Akerkar, R., P. Lingras,
Building an Intelligent Web: Theory and Practice
, Jones and Bartlett Publishers, Sudbury, MA, 2008.
This provides a number of techniques used in Web mining. Code is provided along with illustrative examples showing how to perform Web-content mining, Web-structure mining and Web-usage mining.
Chang, G., M. J. Haeley, J. A. M. McHugh, J. T. L. Wang,
Mining the World Wide Web: An Information Search Approach
, Kluwer Academic Publishers, Boston, MA, 2001.
This book is an effort to bridge the gap between information search and data mining on the Web. The first part of the book focuses on IR on the Web. The ability to find relevant documents on the Web is essential to the process of Web mining. The cleaner the set of Web documents and data are, the better the knowledge that can be extracted from them. In the second part of the book, basic concepts and techniques on text mining, Web mining, and Web crawling are introduced. A case study, in the last part of the book, focuses on a search engine prototype called EnviroDaemon.
Garcia, E., SVD and LSI Tutorial 4: Latent Semantic Indexing (LSI) How-to Calculations, Mi Islita, 2006,
http://www.miislita.com/information-retrieval-tutorial/svd-lsi-tutorial-4-lsi-how-to-calculations.html
.
This Web tutorial provides students with a greater understanding of latent semantic indexing. It provides a detailed tutorial aimed at students. All calculations are pictured giving the student an opportunity to walk through the entire process.
Han, J., M. Kamber,
Data Mining: Concepts and Techniques
, 2nd edition, San Francisco, Morgan Kaufmann, 2006.
This book gives a sound understanding of data-mining principles. The primary orientation of the book is for database practitioners and professionals with emphasis on OLAP and data warehousing. In-depth analysis of association rules and clustering algorithms is the additional strength of the book. All algorithms are presented in easily understood pseudo-code, and they are suitable for use in real-world, large-scale data-mining projects, including advanced applications such as Web mining and text mining.
Mulvenna, M. D., et al., ed., Personalization on the Net Using Web Mining,
CACM
, Vol. 43, No. 8, 2000.
This is a collection of articles that explains state-of-the-art Web-mining techniques for developing personalization systems on the Internet. New methods are described for analyses of Web-log data in a user-centric manner, influencing Web-page content, Web-page design, and overall Web-site design.
Zhang, Q., R. S. Segall, Review of Data, Text and Web Mining Software,
Kybernetes
, Vol. 39, No. 4, 2010, pp. 625–655.
The paper reviews and compares selected software for data mining, text mining, and Web mining that are not available as free open-source software. The software for data mining are SAS
®
Enterprise Miner™, Megaputer PolyAnalyst
®
5.0, NeuralWare Predict
®
, and BioDiscovery GeneSight
®
. The software for text mining are CompareSuite, SAS
®
Text Miner, TextAnalyst, VisualText, Megaputer PolyAnalyst
®
5.0, and WordStat. The software for Web mining are Megaputer PolyAnalyst
®
, SPSS Clementine
®
, ClickTracks, and QL2. The paper discusses and compares the existing features, characteristics, and algorithms of selected software for data mining, text mining, and Web mining, respectively.
12
ADVANCES IN DATA MINING
Chapter Objectives
- Analyze the characteristics of graph-mining algorithms and introduce some illustrative examples.
- Identify the required changes in data-mining algorithm when temporal and spatial components are introduced.
- Introduce the basic characteristics of distributed data-mining algorithms and specific modifications for distributed Density-Based Spatial Clustering of Applications with Noise (DBSCAN) clustering.
- Describe the differences between causality and correlation.
- Introduce the basic principles in Bayesian networks modeling.
- Know when and how to include privacy protection in a data-mining process.
- Summarize social and legal aspects of data-mining applications.
Current technological progress permits the storage and access of large amounts of data at virtually no cost. These developments have created unprecedented opportunities for large-scale data-driven discoveries, as well as the potential for fundamental gains in scientific and business understanding. The popularity of the Internet and the Web makes it imperative that the data-mining framework is extended to include distributed, time- and space-dependent information and tools. New complex and distributed systems are supported by enhanced multimedia data sources such as images and signals, and advanced data structures such as graphs. In this environment, data-mining applications have new social and legal challenges, and privacy preservation is one of the priority tasks.
12.1 GRAPH MINING
Traditional data-mining tasks such as association-rule mining, market-basket analysis, and cluster analysis commonly attempt to find patterns in a data set characterized by a collection of independent instances of a single relation. This is consistent with the classical statistical inference problem of trying to identify a model given a random sample from a common underlying distribution. An emerging challenge for data mining is the problem of mining richly structured data sets, where the objects are linked in some way. Many real-world data sets describe a variety of entity types linked via multiple types of relations. These links provide additional context that can be helpful for many data-mining tasks. Yet multi-relational data violate the traditional assumption of independent, identically distributed data instances that provides the basis for many statistical machine-learning algorithms. Naively applying traditional statistical inference procedures, which assume that samples are independent, may lead in many applications to inappropriate conclusions. Care must be taken that potential correlations due to links between samples are handled appropriately. In fact, record linkage is knowledge that should be exploited. Clearly, this is information that can be used to improve the predictive accuracy of the learned models: Attributes of linked objects are often correlated and links are more likely to exist between objects that have some commonality. Relationships between objects represent a rich source of information, and ultimately knowledge. Therefore, new approaches that can exploit the dependencies across the attribute and link structure are needed. Certainly, as a general data structure, a graph can meet the demands of modeling complicated relations among data.
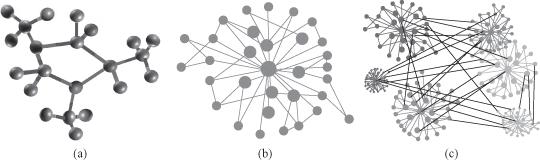
Graph-based data mining represents a collection of techniques for mining the relational aspects of data represented as a graph. It has the task of finding novel, useful, and understandable graph-theoretic patterns in a graph representation of data. Graph mining has become an important topic of research recently because of numerous applications to a wide variety of data-mining problems in computational biology, chemical data analysis, drug discovery, and communication networking. Some examples of graph-represented data are presented in Figure
12.1
. Traditional data-mining and management algorithms such as clustering, classification, frequent-pattern mining, and indexing have now been extended to the graph scenario. While the field of graph mining has been a relatively recent development in the data-mining community, it has been studied under different names by other groups of researchers. This is because research on graphs has a long history in mathematics, but most notably important results are obtained by sociologists in the field of a social network analysis. However, there are important differences, and the primary one is that of network size. Social networks are, in general, small, with the larger studies considering a few hundred nodes. On the other hand, graph-mining data sets in new application domains may typically consist of hundreds of thousands of nodes and millions of edges.
Figure 12.1.
Graph representation of data. (a) Chemical compound; (b) social network; (c) genome co-expression network.
Many data sets of interest today are best described as a linked collection of interrelated objects. These may represent homogeneous networks, in which there is a single-object type and a single-link type, or richer, heterogeneous networks, in which there may be multiple object and link types, and possibly other semantic information. Examples of homogeneous networks include single-mode social networks, such as people connected by friendship links, or the World Wide Web (WWW), a collection of linked Web pages. Examples of heterogeneous networks include those in medical domains describing patients, diseases, treatments, and contacts, or in bibliographic domains describing publications, authors, and venues. Graph-mining techniques explicitly consider these links when building predictive or descriptive models of the linked data.
The requirement of different applications with graph-based data sets is not very uniform. Thus, graph models and mining algorithms that work well in one domain may not work well in another. For example, chemical data is often represented as graphs in which the nodes correspond to atoms, and the links correspond to bonds between the atoms. The individual graphs are quite small although there are significant repetitions among the different nodes. Biological data are modeled in a similar way as chemical data. However, the individual graphs are typically much larger. Protein interaction networks link proteins that must work together to perform some particular biological functions. A single biological network could easily contain thousands of nodes. In the case of computer networks and the Web, the number of nodes in the underlying graph may be massive. Computer networks consist of routers/computers representing nodes, and the links between them. Since the number of nodes is massive, this can lead to a very large number of distinct edges. Social networks may be modeled with large graphs that are defined by people who appear as nodes, and links that correspond to communications or relationships between these different people. The links in the social network can be used to determine relevant communities, members with particular expertise sets, and the flow of information in the social network. For example, the problem of community detection in social networks is related to the problem of node clustering of very large graphs. In this case, we wish to determine dense clusters of nodes based on the underlying linkage structure. It is clear that the design of a particular mining algorithm depends upon the application domain at hand.
Before introducing some illustrative examples of graph-mining techniques, some basic concepts from graph theory will be summarized. Graph theory provides a vocabulary that can be used to label and denote many structural properties in data. Also, graph theory gives us mathematical operations and ideas with which many of these properties can be quantified and measured.
A graph G = G(N, L) consists of two sets of information: a set of nodes N = {n
1
, n
2
, … , n
k
} and a set of links between pairs of nodes L = {l
1
, l
2
,…, l
m
}. A graph with nodes and without links is called an empty graph, while the graph with only one node is a trivial graph. Two nodes n
i
and n
j
are
adjacent
if there is a link between them. A graph G(N, L) can be presented as a diagram as in Figure
12.2
a in which points depict nodes, and lines between two points are links. A graph G′(N′, L′) is a subgraph of G(N, L) if N′ ⊆ N and L′ ⊆ L.
Figure 12.2.
Undirected, directed, and weighted graphs.
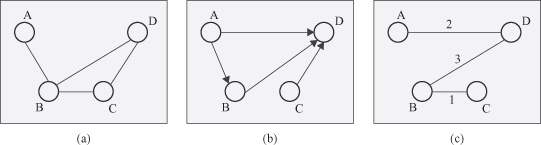
An induced subgraph of a graph
G
has a subset of the nodes of
G,
and the same links between pairs of nodes as in
G
. For example, the subgraph (b) in Figure
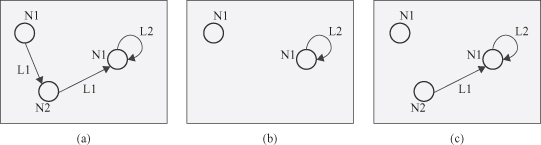
12.3
is an induced subgraph of the graph (a), but the subgraph (c) is a general subgraph but not an induced subgraph of G, since the incoming link L
1
of the node labeled
N
2 in (a) is not retained in (c) while the node labeled
N
2 is included.
Figure 12.3.
An induced subgraph and a general graph.
The degree of a node, denoted by d(n
i
), is the number of links connected to the given node. Equivalently, the degree of a node is the number of nodes adjacent to it. For example, in Figure
12.2
a the degree d(B) = 3. The degree of a node ranges from a minimum of 0 if no nodes are adjacent to a given node, and to a maximum of k − 1 if a given node is adjacent to all the other nodes in the graph. The degrees are very easy to compute, and yet they can be very informative for many applications. For some applications, it is useful to summarize the degrees of all nodes in the graph. The mean nodal degree is a statistic that reports the average degree of the nodes in the graph:

For the graph in Figure
12.2
a, d
av
= (1 + 3 + 2 + 2)/4 = 2. One might also be interested in the variability of the nodal degrees. If all the degrees of all nodes are equal, the graph is said to be d-regular, and its variability is equal to 0. If the nodes differ in degrees, the variance is calculated as a measure for variability: