Ross & Wilson Anatomy and Physiology in Health and Illness (41 page)
Read Ross & Wilson Anatomy and Physiology in Health and Illness Online
Authors: Anne Waugh,Allison Grant
Tags: #Medical, #Nursing, #General, #Anatomy

Figure 5.20
The stages of the cardiac cycle.
Stages of the cardiac cycle
Taking 74 bpm as an example, each cycle lasts about 0.8 of a second and consists of:
•
atrial systole
– contraction of the atria
•
ventricular systole
– contraction of the ventricles
•
complete cardiac diastole
– relaxation of the atria and ventricles.
It does not matter at which stage of the cardiac cycle a description starts. For convenience the period when the atria are filling has been chosen.
The superior vena cava and the inferior vena cava transport deoxygenated blood into the right atrium
at the same time
as the four pulmonary veins bring oxygenated blood into the left atrium. The atrioventricular valves are open and blood flows passively through to the ventricles. The SA node triggers a wave of contraction that spreads over the myocardium of both atria, emptying the atria and completing ventricular filling (atrial systole 0.1 s). When the electrical impulse reaches the AV node it is slowed down, delaying atrioventricular transmission. This delay means that the mechanical result of atrial stimulation, atrial contraction, lags behind the electrical activity by a fraction of a second. This allows the atria to finish emptying into the ventricles before the ventricles begin to contract. After this brief delay, the AV node triggers its own electrical impulse, which quickly spreads to the ventricular muscle via the AV bundle, the bundle branches and Purkinje fibres. This results in a wave of contraction which sweeps upwards from the apex of the heart and across the walls of both ventricles pumping the blood into the pulmonary artery and the aorta (ventricular systole 0.3 s). The high pressure generated during ventricular contraction is greater than that in the aorta and forces the atrioventricular valves to close, preventing backflow of blood into the atria.
After contraction of the ventricles there is
complete cardiac diastole
, a period of
0.4 seconds
, when atria and ventricles are relaxed. During this time the myocardium recovers in preparation for the next heartbeat, and the atria refill in preparation for the next cycle.
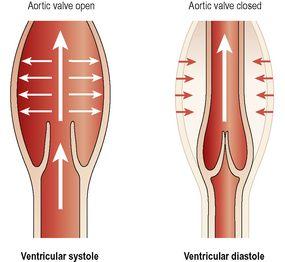
The valves of the heart and of the great vessels open and close according to the pressure within the chambers of the heart. The AV valves are open while the ventricular muscle is relaxed during atrial filling and systole. When the ventricles contract there is a rapid increase in the pressure in these chambers, and when it rises above atrial pressure the atrioventricular valves close. When the ventricular pressure rises above that in the pulmonary artery and in the aorta, the pulmonary and aortic valves open and blood flows into these vessels. When the ventricles relax and the pressure within them falls, the reverse process occurs. First the pulmonary and aortic valves close, then the atrioventricular valves open and the cycle begins again. This sequence of opening and closing valves ensures that the blood flows in only one direction (
Fig. 5.21
). This figure also shows how the walls of the aorta and other elastic arteries stretch and recoil in response to blood pumped into them.
Figure 5.21
The elasticity of the wall of the aorta.
Heart sounds
The individual is not usually conscious of his heartbeat, but if the ear, or the diaphragm of a stethoscope, is placed on the chest wall a little below the left nipple and slightly nearer the midline the heartbeat can be heard.
There are four heart sounds, each corresponding to a particular event in the cardiac cycle. The first two are most easily distinguished, and sound through the stethoscope like “lub dup”. The first sound, ‘
lub’
, is fairly loud and is due to the closure of the atrioventricular valves. This corresponds with the start of ventricular systole. The second sound, ‘
dup’
, is softer and is due to the closure of the aortic and pulmonary valves. This corresponds with ventricular diastole.
Electrical changes in the heart
As the body fluids and tissues are good conductors of electricity, the electrical activity within the heart can be detected by attaching electrodes to the limbs and chest. The pattern of electrical activity may be displayed on an oscilloscope screen or traced on paper. The apparatus used is an
electrocardiograph
and the tracing is an
electrocardiogram
(ECG).
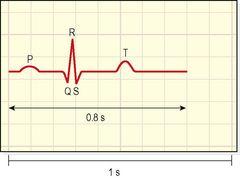
The normal ECG tracing shows five waves which, by convention, have been named P, Q, R, S and T (
Fig. 5.22
).
Figure 5.22
Electrocardiogram of one cardiac cycle.
The P wave arises when the impulse from the SA node sweeps over the atria (atrial depolarisation).
The QRS complex represents the very rapid spread of the impulse from the AV node through the AV bundle and the Purkinje fibres and the electrical activity of the ventricular muscle (ventricular depolarisation). Note the delay between the completion of the P wave and the onset of the QRS complex. This represents the conduction of the impulse through the AV node, which, as was explained earlier, is much slower than conduction elsewhere in the heart, and allows atrial contraction to finish completely before ventricular contraction starts.
The T wave represents the relaxation of the ventricular muscle (ventricular repolarisation). Atrial repolarisation occurs during ventricular contraction, and so is not seen because of the larger QRS complex.
The ECG described above originates from the SA node and is known as
sinus rhythm
. The rate of sinus rhythm is 60 to 100 beats per minute. A faster heart rate is called
tachycardia
and a slower heart rate,
bradycardia
.
By examining the pattern of waves and the time interval between cycles and parts of cycles, information about the state of the myocardium and the cardiac conduction system is obtained.
Myocardial energy sources
As mentioned above, the heart receives an excellent blood supply, out of proportion to its size, ensuring a good supply of oxygen and nutrients. Normal energy production in the heart comes from aerobic breakdown of fats and sugars.
Cardiac output
The cardiac output is the amount of blood ejected from each ventricle every minute. The amount expelled by each contraction of each ventricle is the
stroke volume
. Cardiac output is expressed in litres per minute (l/min) and is calculated by multiplying the stroke volume by the heart rate (measured in beats per minute):

In a healthy adult at rest, the stroke volume is approximately 70 ml and if the heart rate is 72 per minute, the cardiac output is 5 l/minute. This can be greatly increased to meet the demands of exercise to around 25 l/minute, and in athletes up to 35 l/minute. This increase during exercise is called the
cardiac reserve
.
When increased blood supply is needed to meet increased tissue requirements of oxygen and nutrients, heart rate and/or stroke volume can be increased (see
Box 5.2
).
Box 5.2
Summary of factors affecting cardiac output
Factors affecting stroke volume:
•
VEDV (ventricular end-diastolic volume – preload)
•
Venous return
–
position of the body
–
skeletal muscle pump
–
respiratory pump
•
Strength of myocardial contraction
•
Blood volume.


