Wallach's Interpretation of Diagnostic Tests: Pathways to Arriving at a Clinical Diagnosis (616 page)
Authors: Mary A. Williamson Mt(ascp) Phd,L. Michael Snyder Md

BOOK: Wallach's Interpretation of Diagnostic Tests: Pathways to Arriving at a Clinical Diagnosis
3.68Mb size Format: txt, pdf, ePub
Metabolic alkalosis patients may be volume depleted and chloride responsive or have volume expansion and be chloride resistant.
When the urine chloride is low (<10 mmol/L) and the patient responds to chloride treatment, the cause is more likely loss of gastric juice, diuretic therapy, or rapid relief of chronic hypercapnia. Chloride replacement is completed when urine chloride remains >40 mmol/L.
When the urine chloride is high (20 mmol/L) and the patient does not respond to NaCl treatment, the cause is more likely hyperadrenalism or severe potassium deficiency.
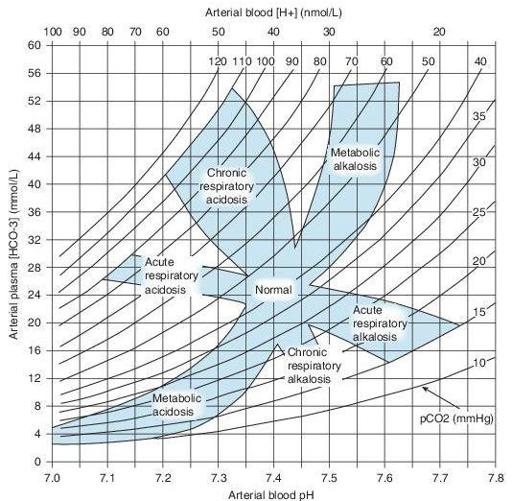
Acid–base maps (Figure
13-4
) are a graphic solution of the Henderson-Hasselbalch equation, which predicts the HCO
3
‒
value for each set of pH/ pCO
2
coordinates. They also allow a check of the consistency of ABG and automated analyzer determinations, since these may determine the total CO
2
content, of which 95% is HCO
3
−
.
These maps contain bands that show the 95% probability range of values for each disorder. If the pH/pCO
2
coordinate is outside the 95% confidence band, then the patient has at least two acid–base disturbances.
These maps are of particular use when one of the acid–base disturbances is not suspected clinically. If the coordinates lie within a band, it is not a guarantee of a simple acid–base disturbance.

Figure 13–4
Acid–base map. The values demarcated for each disorder represent a 95% probability range for each pure disorder. Coordinates lying outside these zones suggest mixed acid–base disorders.
METABOLIC ACIDOSIS
With Increased Anion Gap (AG >15 mmol/L)
Lactic acidosis—most common cause of metabolic acidosis with increased AG (frequently >25 mmol/L) (see following section “Lactic Acidosis”)
Renal failure (AG <25 mmol/L)
Ketoacidosis
DM (AG frequently >25 mmol/L)
Other books
Earth Girls Aren't Easy by Charlene Teglia
The Dreamer's Curse (Book 2) by Honor Raconteur
The Kiss of Deception by Mary E. Pearson
i 8383b91bded90ce1 by Unknown
Lying by Lauren Slater
Penny Dreadful Multipack Vol. 1 (Illustrated. Annotated. 'Wagner The Wehr-Wolf,' 'Varney The Vampire,' 'The Mysteries of London Vol. 1' + Bonus Features) (Penny Dreadful Multipacks) by George W. M. Reynolds, James Malcolm Rymer
Dark Swan Bundle by Richelle Mead
Something About Love: A YA contemporary romance in verse by Johnson, Elana
The Bomber by Liza Marklund
Plains Song by Wright Morris