Data Mining (39 page)
Authors: Mehmed Kantardzic

Another measure of the central tendency of a data set is the
mode
. The mode for the set of data is the value that occurs most frequently in the set. While mean and median are characteristics of primarily numeric data sets, the mode may be applied also to categorical data, but it has to be interpreted carefully because the data are not ordered. It is possible for the greatest frequency to correspond to several different values in a data set. That results in more than one mode for a given data set. Therefore, we classify data sets as unimodal (with only one mode) and multimodal (with two or more modes). Multimodal data sets may be precisely defined as bimodal, trimodal, and so on. For unimodal frequency curves that are moderately asymmetrical, we have the following useful empirical relation for numeric data sets

that may be used for an analysis of data set distribution and the estimation of one central-tendency measure based on the other two.
As an example, let us analyze these three measures on the simple data set T that has the following numeric values:
After a sorting process the same data set is given as
The corresponding descriptive statistical measures for central tendency are


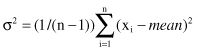
The degree to which numeric data tend to spread is called dispersion of the data, and the most common measures of dispersion are the
standard deviation
σ and the
variance
σ
2
. The variance of n numeric values x
1
, x
2
, … , x
n
is
The standard deviation σ is the square root of the variance σ
2
. The basic properties of the standard deviation σ as a measure of spread are
1.
σ
measures spread about the
mean
and should be used only when the
mean
is chosen as a measure of the center.
2.
σ = 0 only when there is no spread in the data, that is, when all measurements have the same value. Otherwise σ > 0.
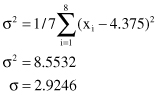
For the data set given in our example,
variance
σ
2
and
standard deviation
σ are
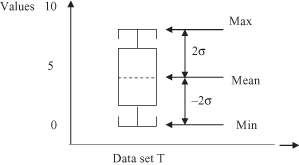
In many statistical software tools, a popularly used visualization tool of descriptive statistical measures for central tendency and dispersion is a
boxplot
that is typically determined by the mean value, variance, and sometimes max and min values of the data set. In our example, the minimal and maximal values in the T set are min
T
= 0, and max
T
= 9. Graphical representation of statistical descriptors for the data set T has a form of a boxplot, given in Figure
5.1
.
Figure 5.1.
A boxplot representation of the data set T based on mean value, variance, and min and max values.
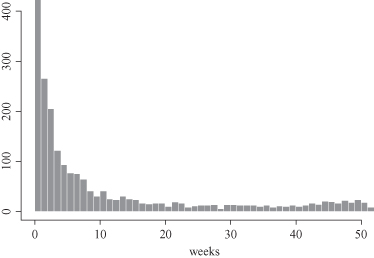
Analyzing large data sets requires proper understanding of the data in advance. This would help domain experts to influence the data-mining process and to properly evaluate the results of a data-mining application. Central tendency measures for a data set are valuable only for some specific distributions of data values. Therefore, it is important to know the characteristics of a distribution for a data set we are analyzing. The distribution of values in a data set is described according to the spread of its values. Usually, this is best done using a histogram representation; an example is given in Figure
5.2
. In addition to quantifying the distribution of values for each feature, it is also important to know the global character of the distributions and all specifics. Knowing that data set has a classic bell curve empowers researchers to use a broad range of traditional statistical techniques for data assessment. But in many practical cases, the distributions are skewed or multimodal, and traditional interpretations of concepts such as mean value or standard deviation do not make sense.
Figure 5.2.
Displaying a single-feature distribution.
Part of the assessment process is determining relations between features in a data set. Simple visualization through the scatter plots gives initial estimation of these relations. Figure
5.3
shows part of the integrated scatter plot where each pair of features is compared. This visualization technique is available in most integrated data-mining tools. Quantification of these relations is given through the correlation factor.