Read iOS Programming: The Big Nerd Ranch Guide, 3/e (Big Nerd Ranch Guides) Online
Authors: Aaron Hillegass,Joe Conway
Tags: #COM051370, #Big Nerd Ranch Guides, #iPhone / iPad Programming
iOS Programming: The Big Nerd Ranch Guide, 3/e (Big Nerd Ranch Guides) (20 page)

When an application is launched from
Xcode
, the debugger is attached to it. The debugger monitors the current state of the application, like what method it is currently executing and the values of the variables that are accessible from that method. Using the debugger can help you understand what an application is actually doing, which, in turn, helps you find and fix bugs.
One way to use the debugger is to set a
breakpoint
. Setting a breakpoint on a line of code pauses the execution of the application at that line (before it executes). Then you can execute the subsequent code line by line. This is useful when your application is not doing what you expected and you need to isolate the problem.
In
WhereamiViewController.m
, find the line of code in
initWithNibName:bundle:
where you instantiate the
CLLocationManager
. Set a breakpoint by clicking the gutter (the lightly shaded bar on the left side of the editor area) next to that line of code (
Figure 4.9
). The blue indicator shows you where the application will
“
break
”
the next time you run it.
Figure 4.9 A breakpoint
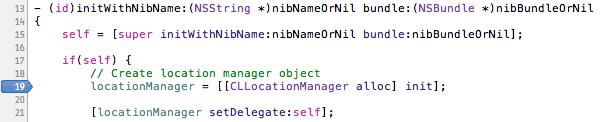
Build and run the application. The application will start and then halt before the line of code where you put the breakpoint. Notice the green indicator that appears on the same line as the breakpoint. This indicator shows you the current point of execution.
Now our application is temporarily frozen in time, and we can examine it more closely. In the navigator area, click the icon to open the
debug navigator
. This navigator shows a
stack trace
of where the breakpoint stopped execution. A stack trace shows you the methods and functions whose frames were in the stack when the application broke. The slider at the bottom of the debug navigator expands and collapses the stack. Drag it to the right to see all of the methods in the stack trace. (
Figure 4.10
).
Figure 4.10 The debug navigator
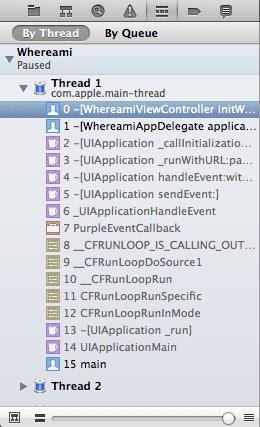
The method where the break occurred is at the top of the stack trace. It was called by the method just below it, which was called by the method just below it, and so on. This chain of method calls continues all the way back to
main
. Notice that the two methods that you implemented are in black text and the methods belonging to Apple are in gray.
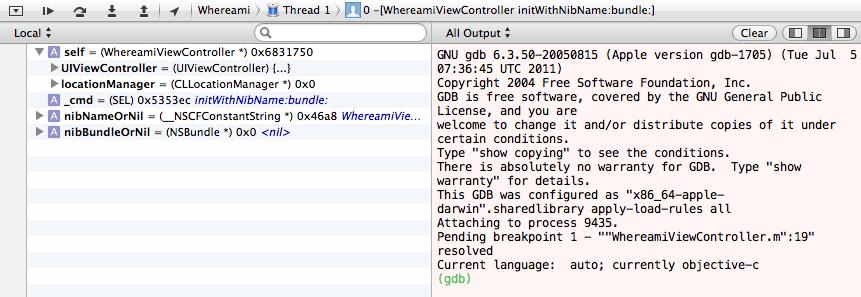
Select the method at the top of the stack. This will display the implementation of
initWithNibName:bundle:
in the editor area. Below the editor area, check out the variables view to the left of the console. This area shows the variables within the scope of this method along with their current values (
Figure 4.11
).
Figure 4.11 Debug area with variables view
(If you don’t see the variables view, find the control above the console. Click the center button to see both the console and the variables view.)
In the variables view, a pointer variable shows the object’s address in memory. (There are some exceptions; for an
NSString
, the actual string is shown instead.) A variable that is not a pointer, like
int
, just shows its value.
Click the disclosure button next to
self
. The first item under
self
is its superclass. In the context of this method,
self
is a pointer to the instance of
WhereamiViewController
, so its superclass is
UIViewController
. Clicking the disclosure button next to
UIViewController
will show the variables
self
inherits from its superclass.
After the superclass, the object’s instance variables are listed, which for
WhereamiViewController
is just
locationManager
. The breakpoint is set to the line that creates the instance of
CLLocationManager
and assigns it to
locationManager
. That line of code has yet to be executed, so
locationManager
is still set to
nil
(
0x0
).
In addition to giving you a snapshot of the application at a given point, the debugger also allows you to
step through
your code line by line and see what your application does as each line executes. The buttons that control the execution are on the
debugger bar
that sits between the editor area and the debug area (
Figure 4.12
).
Figure 4.12 Debugger bar
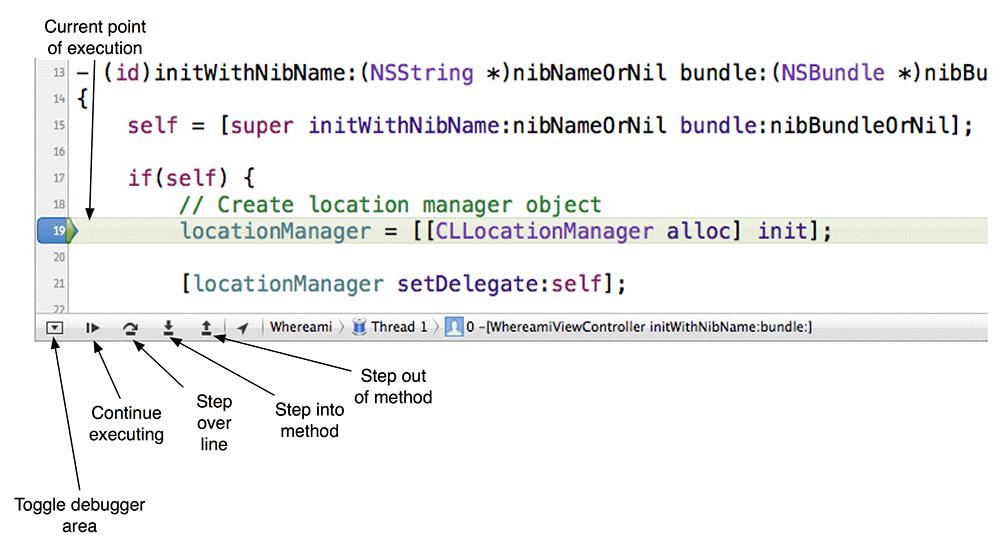
Click the button that steps over a line. This will execute just the current line of code, which instantiates the
CLLocationManager
. Notice that the green execution indicator moves to the next line. Even more interesting, the variables view shows that the value of
locationManager
has changed to a valid address in memory – this object is now alive and well.
At this point, you could continue stepping through the code to see what happens. Or you could click the button to continue executing your code normally. Or you could step into a method. Stepping into a method takes you to the method that is called by the line of code that currently has the green execution indicator. Once you’re in the method, you have the chance to step through its code in the same way.
Let’s add a method that we can step into and out of. Declare the following method in
WhereamiViewController.h
.
#import
@interface WhereamiViewController : UIViewController
{
CLLocationManager *locationManager;
}
- (void)doSomethingWeird;
@end
In
WhereamiViewController.m
, implement this method to log some stuff to the console.
{
NSLog(@"Line 1");
NSLog(@"Line 2");
NSLog(@"Line 3");
}
Next in
WhereamiViewController.m
, send this message to the instance of
WhereamiViewController
in
initWithNibName:bundle:
.
{
self = [super initWithNibName:nibNameOrNil bundle:nibBundleOrNil];
if (self) {
// Create location manager object
locationManager = [[CLLocationManager alloc] init];
[self doSomethingWeird];
Finally, drag your breakpoint to this newly-implemented line. Build and run the application.
When the execution halts, click the button on the debugger bar to step into this method. The execution indicator will jump
inside
the
doSomethingWeird
method to the first line of its implementation. Now click the button to step over a line. The line of code that logs
Line 1
will execute, and you will see its text in the console.
The execution indicator is now at the statement that logs
Line 2
. If you’ve decided that you’ve seen enough of this fascinating method, you can click the button to step out of it. Notice that the rest of the log statements appear in the console, and the execution indicator is now back in
initWithNibName:bundle:
– right after the call to
doSomethingWeird
. This behavior is important to understand: when you step out of a method, you don’t cancel its execution; the method finishes normally and returns to the code that called it.
To remove the breakpoint, simply drag it off the gutter. Or click the icon in the navigator selector to reveal the breakpoint navigator and see all the breakpoints in your project. From there, you can select a breakpoint and hit the delete key.
Sometimes, a new developer will set a breakpoint and forget about it. Then, when the application is run, execution stops, and it looks like the application has crashed. If an application of yours unexpectedly halts, make sure you aren’t stopped on a forgotten breakpoint.