Data Mining (44 page)
Authors: Mehmed Kantardzic

For our simple example of linear regression given at the beginning of this section, the model obtained was B = 0.8 + 0.92A. We may estimate the quality of the model using the correlation coefficient r as a measure. Based on the available data in Figure 4.3, we obtained intermediate results


and the final correlation coefficient:
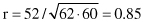
A correlation coefficient r = 0.85 indicates a good linear relationship between two variables. Additional interpretation is possible. Because r
2
= 0.72, we can say that approximately 72% of the variations in the values of B is accounted for by a linear relationship with A.
5.5 ANOVA
Often the problem of analyzing the quality of the estimated regression line and the influence of the independent variables on the final regression is handled through an ANOVA approach. This is a procedure where the total variation in the dependent variable is subdivided into meaningful components that are then observed and treated in a systematic fashion. ANOVA is a powerful tool that is used in many data-mining applications.
ANOVA is primarily a method of identifying which of the β’s in a linear regression model are nonzero. Suppose that the β parameters have already been estimated by the least-square error algorithm. Then the residuals are differences between the observed output values and the fitted values:

The size of the residuals, for all m samples in a data set, is related to the size of variance σ
2
and it can be estimated by:
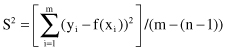
assuming that the model is not over-parametrized. The numerator is called the residual sum while the denominator is called the residual degree of freedom (d.f.).
The key fact about S
2
is that it allows us to compare different linear models. If the fitted model is adequate, then S
2
is a good estimate of σ
2
. If the fitted model includes redundant terms (some β’s are really 0), S
2
is still good and close to σ
2
. Only if the fitted model does not include one or more of the inputs that it ought to, will S
2
tend to be significantly larger than the true value of σ
2
. These criteria are basic decision steps in the ANOVA algorithm, in which we analyze the influence of input variables on a final model. First, we start with all inputs and compute S
2
for this model. Then, we omit inputs from the model one by one. If we omit a useful input the estimate S
2
will significantly increase, but if we omit a redundant input the estimate should not change much. Note that omitting one of the inputs from the model is equivalent to forcing the corresponding β to the 0. In principle, in each iteration we compare two S
2
values and analyze the differences between them. For this purpose, we introduce an F-ratio or F-statistic test in the form

If the new model (after removing one or more inputs) is adequate, then F will be close to 1; a value of F significantly larger than one will signal that the model is not adequate. Using this iterative ANOVA approach, we can identify which inputs are related to the output and which are not. The ANOVA procedure is only valid if the models being compared are nested; in other words, one model is a special case of the other.
Suppose that the data set has three input variables, x
1
, x
2
, and x
3,
and one output Y. In preparation for the use of the linear regression method, it is necessary to estimate the simplest model, in terms of the number of required inputs. Suppose that after applying the ANOVA methodology the results given in Table
5.4
are obtained.
TABLE 5.4.
ANOVA for a Data Set with Three Inputs, x
1
, x
2
, and x
3
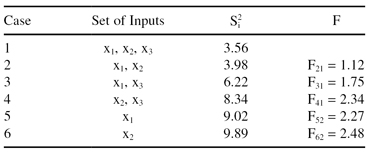
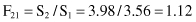
The results of ANOVA show that the input attribute x
3
does not have an influence on the output estimation because the F-ratio value is close to 1:
In all other cases, the subsets of inputs increase the F-ratio significantly, and therefore, there is no possibility of reducing the number of input dimensions further without influencing the quality of the model. The final linear regression model for this example will be
Multivariate
ANOVA (MANOVA) is a generalization of the previously explained ANOVA, and it concerns data-analysis problems in which the output is a vector rather than a single value. One way to analyze this sort of data would be to model each element of the output separately but this ignores the possible relationship between different outputs. In other words, the analysis would be based on the assumption that outputs are not related. MANOVA is a form of analysis that
does
allow correlation between outputs. Given the set of input and output variables, we might be able to analyze the available data set using a multivariate linear model: